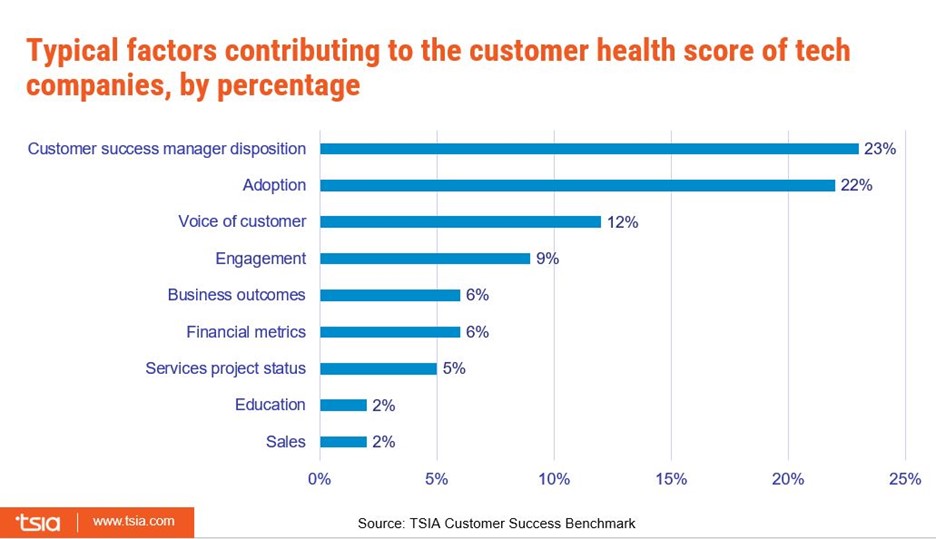
Among business-to-business tech companies, currently the most significant factor in customer health, constituting 23% of the overall score on average, is the customer success manager’s disposition of the account—i.e., the manager’s own assessment of success based on interactions with account contacts, according to TSIA data. The next largest factor, contributing to 22% of the score, is how well the customer is adopting the technology. The voice of the customer, obtained through tools such as satisfaction surveys or net promoter scores, accounts for only 12% of a health score on average.
Tech companies looking to use health scores to guide business decisions need to build that data on a more solid foundation. To be accurate and actionable, a health score should be:
- Derived from a balance of quantitative and qualitative data—High user adoption means nothing if users hate the product and aren’t receiving business value.
- Informed by every customer touchpoint, across sales, service and product—A customer success manager’s disposition may be inadequate if based solely on communications with the account’s primary contact.
- Based on analysis of historical patterns—Artificial intelligence and machine learning can be leveraged to identify specific patterns or events that correlate to renewal rates.
“We continue to see over and over again the buying of technology solutions to solve a retention problem, when really the technology should enable the humans in an organization to have a better understanding, to have better interactions with the customers,” RSM principal Kim Susko said during the TSIA webinar. “Technology won’t solve the problem—it will just enable the humans better.”
Correlating customer journey events to business outcomes
The most sophisticated and accurate approach to calculating a customer health score is to analyze positive and negative variables of the customer journey and their impact on account retention and expansion. Companies can then use this analysis to more accurately predict and understand the disposition of an account.
Positive variables include:
- High customer satisfaction (CSAT)
- Low customer effort
- Rapid adoption
- Customer references
Negative variables include:
- Service disruptions/outages
- Support escalations
- Lagging adoption
- Delayed go-live
Demonstrating the reliability of this approach, in their analysis of support services benchmark data, the TSIA found a very strong correlation between customer satisfaction with support services and customer contract renewal rates. With a p-value of 0.001, there is a greater than 999 in 1,000 chance that this relationship is valid.
The customer journey analytics continuum
As companies begin analyzing years’ worth of customer journeys, they will move from being reactive to proactive. Ultimately, armed with predictive insights, companies will have enough information to begin optimizing the customer experience. Getting to that point will require close monitoring well beyond the initial sale, RSM principal Rich Davis said during the webinar.
“Anytime any organization has a new opportunity, there is absolutely an acute focus on making sure that opportunity is well cared for so that it moves to close—but there are a lot of traces of the DNA of that transaction in that relationship that happens over time,” Davis said. “It’s really about being able to harness that beyond the initial sale, where it becomes really vital to understand those historical trends.”
Still, less than one-third of technology firms are leveraging predictive or prescriptive insights today, according to a TSIA poll, with the majority saying they rely primarily on basic performance and adoption metrics as a data analytics framework.
Companies seeking a more proactive and predictive model to assess customer health should consider the following action items:
- Collect information from customers at all levels about their desired experience and preferred feedback channels, such as surveys, focus groups, interviews or user group sessions.
- Ask for input from support employees, customer success managers, professional services consultants and renewal reps, many of whom receive daily feedback about customer experience.
- Inventory data gathered throughout the customer journey and reflecting the entire customer experience, such as support volume, adoption rate, product requests and customer satisfaction.
- Analyze your CSAT and customer effort score data to understand existing friction points, and work toward identifying correlations between specific events and experiences and customer outcomes such as attrition, renewals and expansion.
- Partner across the enterprise for an end-to-end customer experience strategy to ensure consistency.


