The Real Economy

Interest rates and the path to normalization

How to stop worrying about rising Treasury yields

June 08, 2021
#
The Real Economy

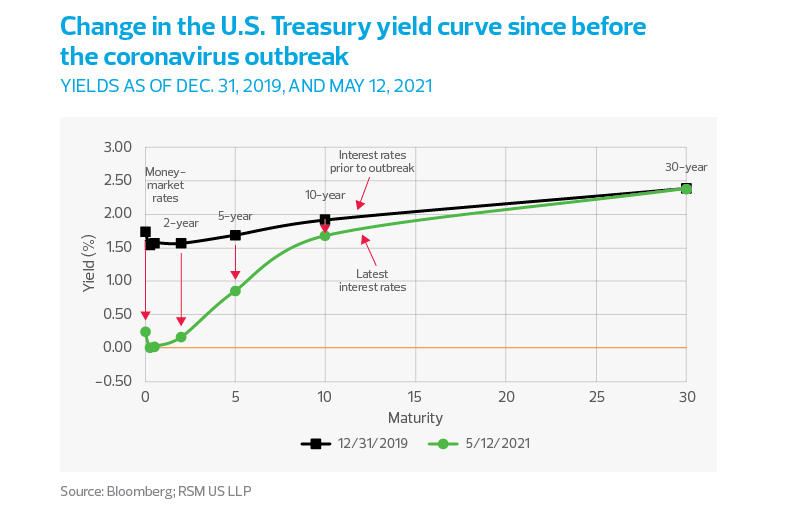
The yield on 10-year Treasury bonds approached 1.7% in May, within 20 basis points of already low pre-pandemic rates. Though that move higher has since moderated, it was in response to signs of an economic recovery and perceived risks around higher inflation.

But sub-2% 10-year interest rates are far from what a healthy economy would support and suggests the need for additional government response in the form of fiscal stimulus and widespread development of intellectual capital despite those perceived risks.

Change in the US Treasury yield curve since before the coronavirus outbreak
chart - interest - TRE 06/21 - chart 1

Changes in real yields

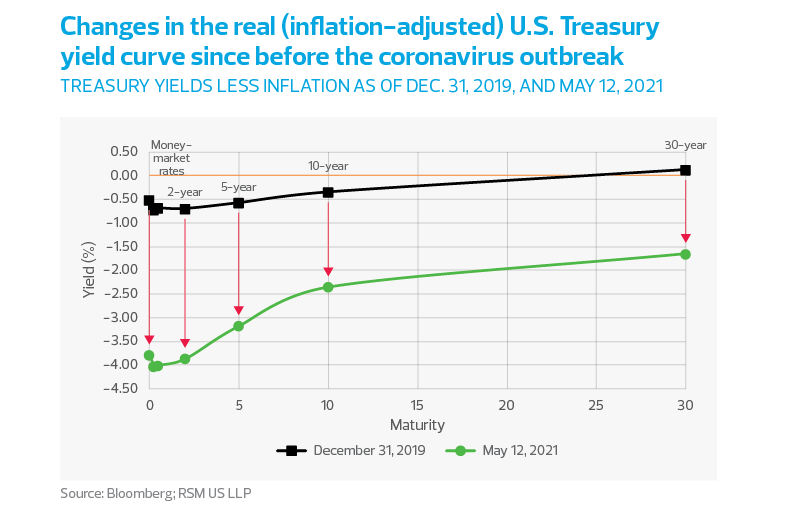
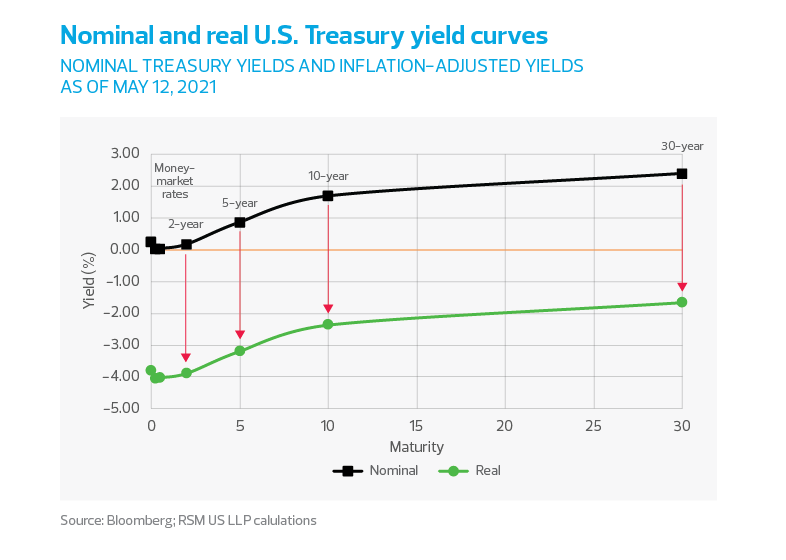
The increase in inflation to 4.2% in April from 2.6% in March has pushed the real (inflation-adjusted) yield on 10-year Treasury bonds even lower, to negative 2.4%. The goal of the monetary policy is to facilitate investments by pressuring interest rates lower. A negative yield curve and expectations for a growing economy and sustained normal levels of inflation will allow those investments to be paid back in inflation-depreciated dollars.

Changes in the real (inflation-adjusted) US Treasury yield curve since before the coronavirus outbreak
chart - interest - TRE 06/21 - chart 2
Nominal and real U.S. Treasury yield curves chart
chart - interest - TRE 06/21 - chart 3

Why rising 10-year yields are a good thing

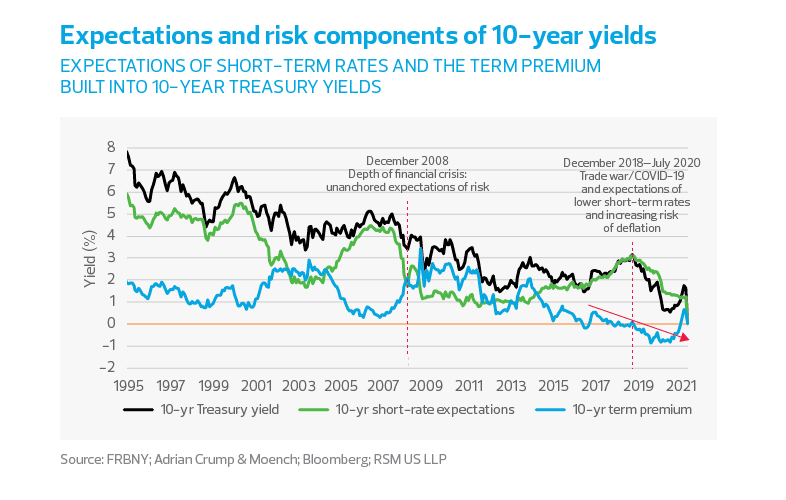
Confidence in the recovery has nearly eliminated the perceived risk of economic collapse and deflation. At the same time, guidance from the Federal Reserve consistently suggests that money market rates will be low for a long time. The result is an economy that can support higher long-term interest rates, while monetary policy pressures short-term bond yields lower—that is, a steep yield curve out to 10 years that is conducive for bond trading.

But there are never straight lines in asset pricing, with recent adjustments in the term premium priced into 10-year Treasury yields, and expectations for short-term rates over the next 10 years.

Expectations and risk components of 10-year yields chart
chart - interest - TRE 06/21 - chart 4

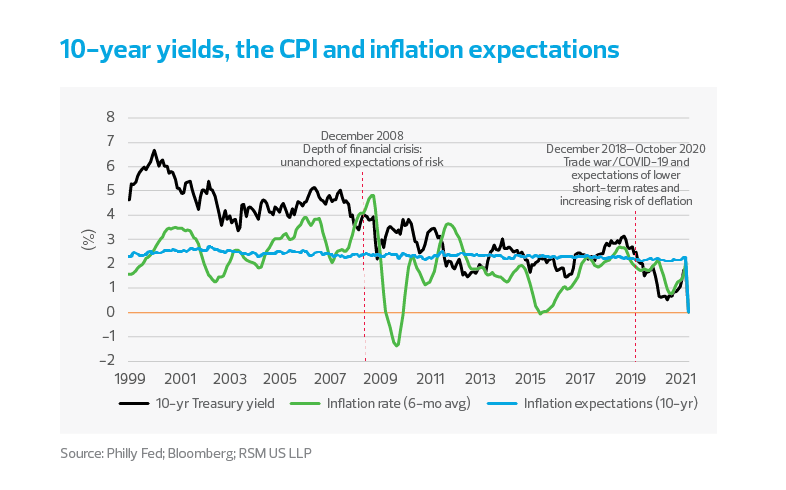
The inflation rate is moving higher, a welcome sign of increased demand and economic activity. Yet inflation expectations have been stable both during the pandemic and as the recovery took shape this year, increasing only slightly to 2.25% in May from 2.10% last August. That is broadly in line with price stability

The Fed has said that because inflation and demand have been abnormally low for so long, it will tolerate inflation rates greater than its 2% target before it undertakes rate hikes.

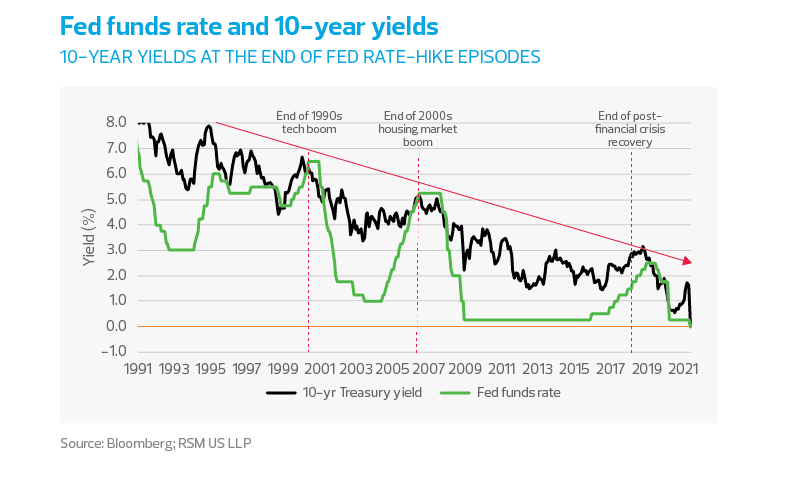
Even if 10-year yields were to reach 2.0% in the months ahead, interest rates would still be below the trend decline in interest rates shown in the analysis below. A break above 2.0% would be a sign of a healthy and competitive economy, and would go a long way to thwarting the development of bubbles in other asset classes.

10-year yields, the CPI and inflation expectations
chart - interest - TRE 06/21 - chart 5
Fed funds rate and 10-year yields
chart - interest - TRE 06/21 - chart 6

When will the economy support higher rates?

Because of the structural shifts in the global economy—automation, the advent of the global supply chain and the adaptation of inflation-targeting by central banks—the expected return on investment has trended lower. This is particularly the case in the aftermath of the global financial crisis and the Great Recession. The world’s developed economies arguably could no longer support the high real (inflation-adjusted) rates of return in earlier decades.

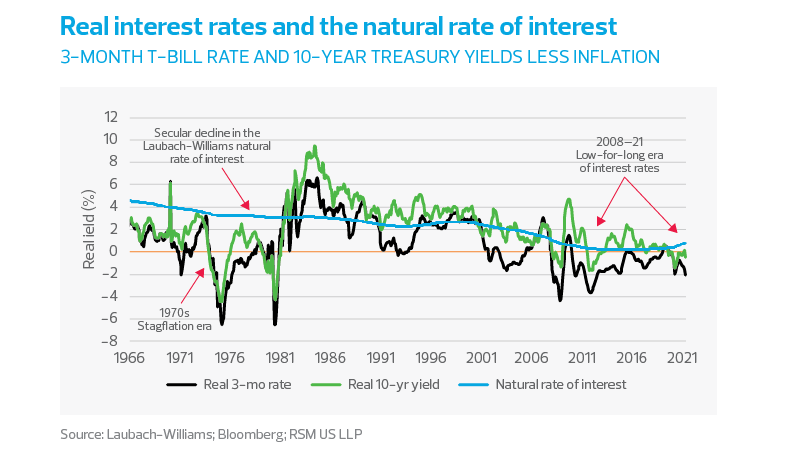
According to an analysis by Kathryn Holston, Thomas Laubach and John C. Williams at the Federal Reserve Bank of San Francisco, the natural rate of interest is defined as “the real short-term interest rate that would prevail absent transitory disturbances.”

Another analysis, by Thomas A. Lubik and Christian Matthes at the Richmond Fed, holds that the natural rate of interest is a hypothetical rate that is “consistent with economic and price stability.”

According to Holston, Laubach and Williams, the natural rate provides a benchmark for monetary policy. Real short-term rates below the natural rate indicate an expansionary policy, while real short-term rates above the natural rate indicate a contractionary policy. According to Lubik and Matthes, “it is not the level of the natural rate that matters, but its value relative to other interest rates.”

During the decade-long recovery from the Great Recession, U.S. real short-term interest rates have been negative and below the natural rate estimates for all but a few occasions.

That indicates an accommodative monetary policy, even during the period of interest-rate normalization near the end of the recent business cycle that drew so much criticism.

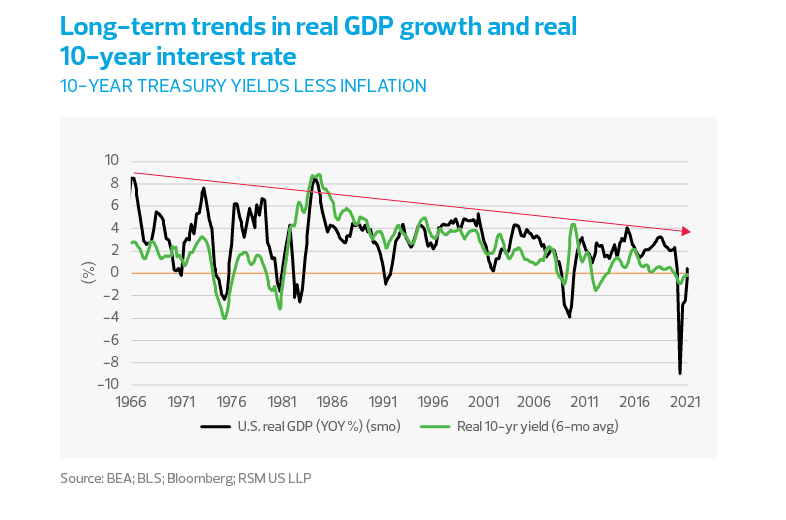
In our opinion, the decline in the natural rate from the Great Recession to the present and the concurrent secular decline in 10-year yields and GDP growth—which we show in the figures below—suggest structural issues in the economy that we have yet to overcome. Despite the best efforts of the monetary authorities, we need to do more to avoid becoming the Japan of this century.

We need to create the foundation for the next economy, both in physical terms—through traditional structural improvements such as rethinking the energy and broadband grids—and in intellectual terms, by addressing the deficiencies in education and health of the labor force.

The United States is no longer the leading exporter of the world. Simply rebuilding the old economy is shortsighted and a waste of resources.

In our estimation, an increase in the natural rate during the first quarter is a positive first step toward the normalization of interest rates, the potential for a sufficient return on investment and the reimagining of the U.S. economy.

Real interest rates and the natural rate of interest chart
chart - interest - TRE 06/21 - chart 7
Long-term trends in real GDP growth and real 10-year interest rates chart
chart - interest - TRE 06/21 - chart 8

Treasury bonds are back in fashion with foreign investors

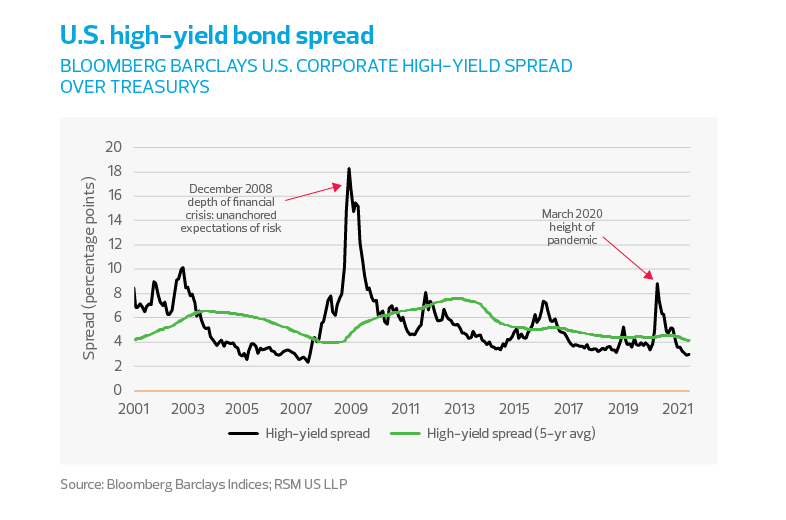
The recovery—or, more to the point, the confidence in the vaccination program and the growth it has helped spur—is best seen in the spread between high-yield corporate bonds and Treasury bonds. A growing economy indicates diminished risk of corporate default, and a reduced premium required to hold those bonds.

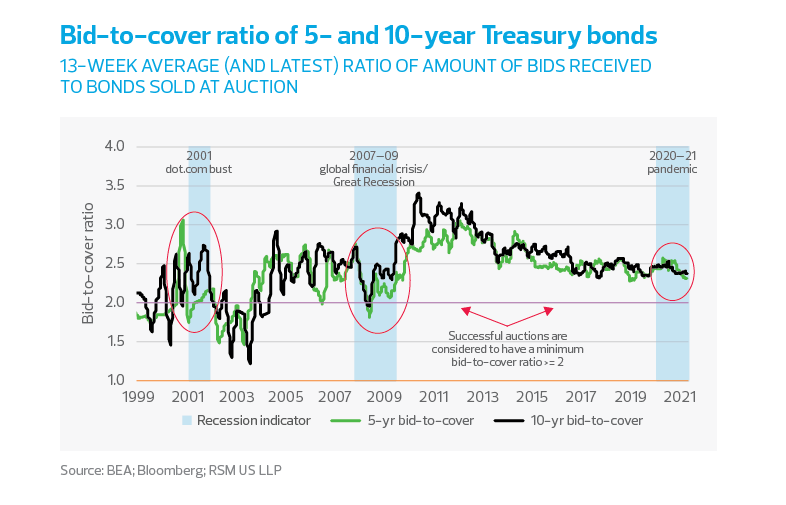
The bid-to-cover ratio has remained comfortably above 2, an indication of the demand for Treasury securities despite their lack of return relative to other, more risky assets.

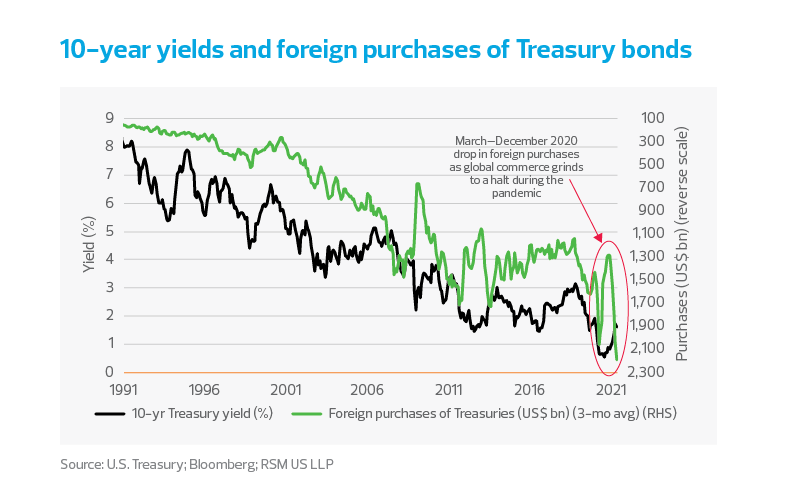
Purchases of Treasury bonds by foreign investors are increasing once again, indicating commercial demand for parking profits from trading with U.S. importers. That suggests that increased consumer demand will augment growth in the manufacturing sector to form the basis for a sustained recovery.

US high-yield bond spread
Bid-to-cover ratio of 5- and 10-year Treasury bonds
10-year yields and foreign purchases of Treasury bonds

RSM contributors

The Real Economy

Monthly economic report

A monthly economic report for middle market business leaders.

Industry outlooks

Industry-specific quarterly insights for the middle market.