The Real Economy

Bottlenecks in the supply chain

Sep 07, 2021
#
Supply chain The Real Economy

The robust economic expansion that is underway is unfolding in a unique fashion, and it is not for the fainthearted. Everything from semiconductors to employees is in short supply as the economy recovers from the shock of the pandemic and as some workers, especially those in lower-paid service jobs, rethink their place in the labor force.

Now, these bottlenecks are leading to a reconsideration of how quickly the global and domestic economy can move beyond 2019 levels. That reassessment, in our estimation, is the primary factor behind the recent volatility across equity and other financial markets.

The disruptions linked to the delta variant are sufficient to represent risks to our growth forecast of 5% for the global economy and 6.6% for the U.S. economy this year and could lead to further price volatility.

Throughout the global health crisis, we have consistently made the case that for the economy to fully recover, the pandemic must be contained. For this to happen, vaccines must be made globally available.

Until then, consumers will find themselves choosing between higher prices for goods and services and delaying purchases until supplies are back to normal. Each has the potential to dampen overall spending and suppress growth.

It all prompts a question: How did we get here? A closer look at the rising virus cases in Southeast Asia and their effect on supply chains and the labor market can offer some insight.

Southeast Asia

To get a sense of the far-reaching impact of the delta variant on the global supply chain, consider the case of Southeast Asia.

Once viewed as a reliable import portal for the U.S. during the pandemic, Southeast Asia has been hit hard by the resurgence of COVID-19.

Nations are now in various levels of economic shutdown, leading to drastic cutbacks in production and severe shortages in vital goods sent to the rest of the world.

This is no small matter to the American middle market economy. The U.S. relied on Southeast Asia for about 21% of its food imports, 12% of machinery and appliance imports, and 10% of consumer goods imports in 2019, before the pandemic. In addition, Southeast Asia shares the same trade route with China, Japan and South Korea, which combine for 27% of all U.S. imports.

The disruptions linked to the delta variant are sufficient to represent risks to our growth forecast of 5% for the global economy and 6.6% for the U.S. economy this year.

For this reason, firms with direct and indirect exposure to Southeast Asian supply chains should prepare for further disruptions later this year that are likely to spill over into next year. Middle market firms may need to look to local U.S. and North American producers as possible substitutes to meet increases in demand.

The third quarter in particular has been a challenge as COVID-19 cases continue to rise and prompt economic shutdowns in major countries, including Indonesia, Thailand, Vietnam, Malaysia and the Philippines. Local governments, in turn, have swiftly enacted strict stay-at-home policies as hospitals contend with a surge in patients. As a result, U.S. imports of goods from these countries started to show signs of decline in June.

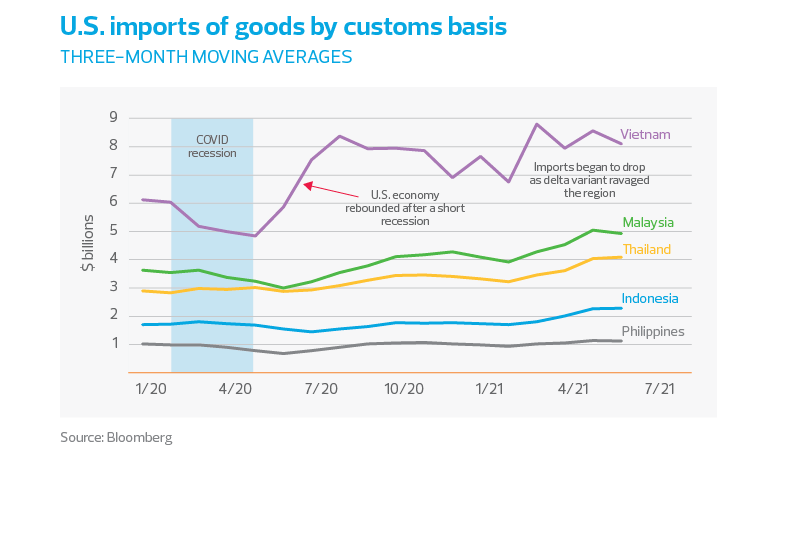
U.S. imports of goods by customs basis (three-month moving averages) chart
chart - transition - TRE 09/21 - chart 1

Vietnam, the sixth-biggest import partner of the United States, will remain in lockdown until at least September, and this is already hitting production. One energy firm in Vietnam reported that sales of oil and petroleum products have plunged by 70% to 80% since the lockdown started.

Companies with major operations in Vietnam, like Samsung, Foxconn, Nike and Intel, have slashed their output in recent months, disrupting the supplies of electronics, garments, textiles and especially semiconductors to the U.S. Vietnam is the second-largest provider of semiconductors to the United States.

In Malaysia, the largest provider of semiconductors to the U.S., new COVID-19 cases have hit a record despite 53.3% of the population having received at least one vaccine dose. At least 1.2 million workers have lost their jobs since the pandemic broke out, while the nation’s political crisis has hindered the country’s COVID-19 response.

The pandemic and its resurgence have shown that strict lockdown policies cannot be the entire answer to the pandemic, but that vaccinations can. Nonetheless, vaccination rates throughout Southeast Asia, except for Singapore, still lag other regions because of scarcity.

Indonesia, the hardest-hit country in the region, is struggling with slow vaccine rollout rates as it tries to vaccinate 182 million people.

Thailand, despite signing a deal with AstraZeneca last year to produce vaccines, has only about 7.5% of its population fully vaccinated and has been considering restricting its vaccine exports to neighboring countries.

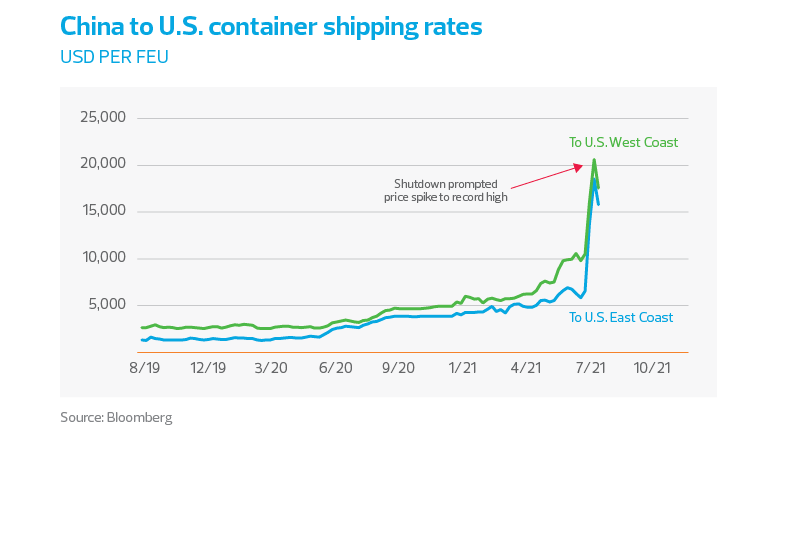
The end result is added pressure on the global supply chain as the U.S. heads into the year-end shopping season. And this pressure extends to China. The world’s third-busiest container port, Ningbo-Zhoushan in China, remains partially closed, pushing container shipping rates for the China-U.S. route to a record $20,000 per 40-foot box.

China to U.S. container shipping rates (USD per FEU)
chart - transition - TRE 09/21 - chart 2

Prices of imports, as a result, have continued to rise. In July, the price index for imports from China rose 0.7%—the largest one-month rise since July 2008—pushing the three-month moving average up to 0.5%. Southeast Asia’s import price index was also up by 0.3% in July after dropping to negative territory in April.

Although the ripple effect of such increases in prices is subtle and will not be felt immediately, it will contribute to the higher inflation rate in the U.S. for the remainder of the year.

Firms with direct and indirect exposure to Southeast Asian supply chains should prepare for further disruptions later this year that are likely to spill over into next year.

Supply chains under strain

As the coronavirus has spread through the world, fault lines in everything from public health preparedness to the transportation infrastructure have been exposed.

The surge in U.S. consumer demand is leading to delays at seaports and rail yards. Warehouses near those seaports are reaching capacity, and there are reports of loaded trains sitting idle alongside single-track routes.

The increase in savings during the pandemic suggests that U.S. consumers have the patience to do without for a little longer. That suggests that increases in the cost of living will exist for as long as the pandemic affects production and shipping among our trading partners.

In recent months, the increase in activity along the supply chain appears to have decelerated because of labor market constraints and infrastructure bottlenecks.

While the infrastructure can be repaired and modernized, disruptions in the labor market have uncovered dissatisfaction with working conditions and income that may accelerate investment in both automation and improvements in employment conditions.

International shipping: Whether you’re waiting for your BMW to be shipped from Europe or a plastic Slip ’N Slide to arrive from Asia, it’s going to take longer and cost more this year than it did last year.

According to data from Drewry Supply Chain Advisors, prices for shipping a 40-foot container from Shanghai to Los Angeles had increased for 18 straight weeks by the end of July. By the end of August, it was costing more than $10,000 to ship a container from Asia–225% higher than last year based on four-week moving averages–and more than $6,000 to ship a container from Rotterdam to New York, an increase of approximately 175% relative to a year ago based on four-week averages.

Intermodal rail freight: Once the shipping container gets to a North American seaport, it needs to be unloaded and then sent to a warehouse somewhere along our train routes or highway system. Intermodal rail freight–shipments of those containers on tractor-trailers or railroad cars—reached an all-time high this spring before tapering off in May and June.

Domestic trucking: If shipments out of Asia are once again halted, we anticipate an easing in the demand for trucking as well as all freight transportation services.

The Truckstop.com Market Demand Index, which measures the ratio of load postings to truck postings, has already dropped 32% from its recent peak in May. This suggests either a tapering of the initial surge in demand or a supply chain reaching its limit.

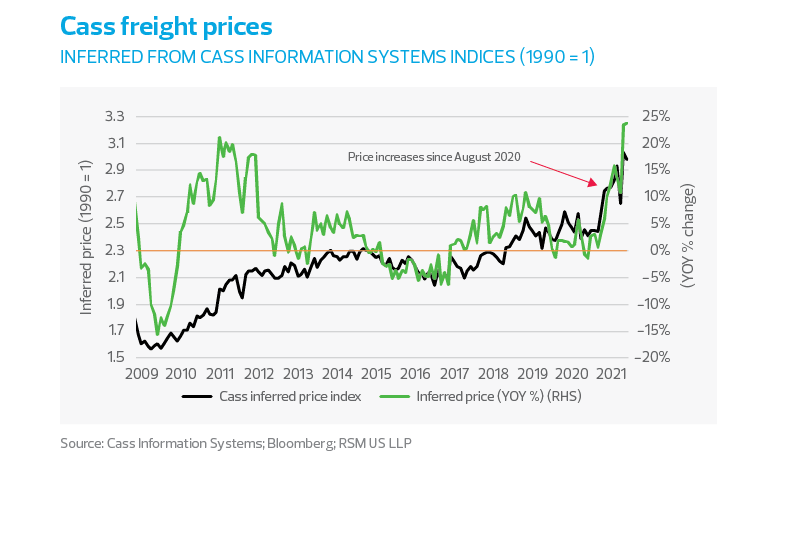
Analysts at Cass Information Systems are suggesting that the drop in July freight shipments was because of capacity constraints of the U.S. freight network. They point to slowdowns in rail and LTL (trucking) volumes attested to by “the 121 container ships anchored off North American ports,” and they view freight price increases as likely to continue because of demand pressures.

Cass freight prices (inferred from Cass information systems indices (1990 = 1)
chart - transition - TRE 09/21 - chart 3

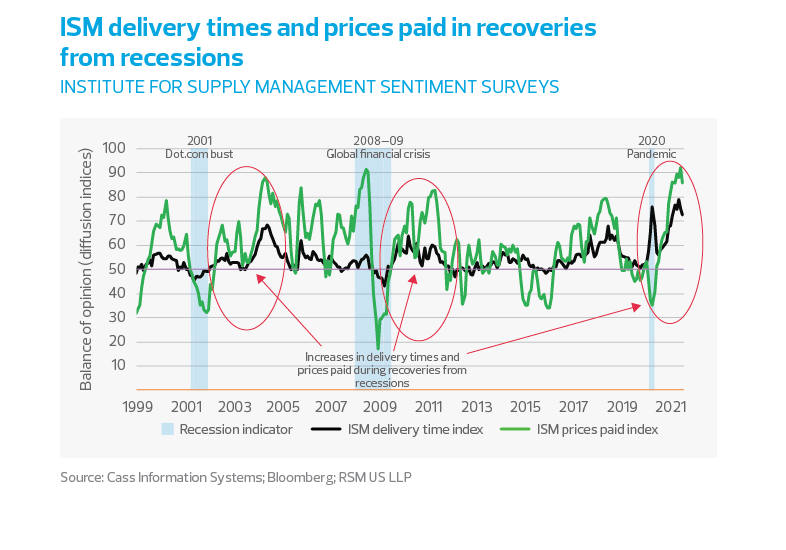
Delivery times and prices: The result of supply chain bottlenecks and the resurgence of demand is slower delivery times for manufacturers (and retailers) and increased prices as demand outstrips supply.

The Institute for Supply Management surveys of manufacturing conditions illustrate the difficulty of supply catching up to demand in the wake of an economic slowdown. This seemed particularly true after the economic shock of the financial crisis in 2007-09 and now after the shock of the pandemic.

These trends conform to findings of the third-quarter RSM US Middle Market Business Index survey, in which 76% of senior executives at middle market firms anticipated higher input prices and supply chains overwhelmed by the surge in demand over the next six months.

While those expectations have eased from the last quarter, when 85% expected higher prices paid for raw materials and intermediate goods, the survey found that only in the current quarter did a majority of executives, or 62%, report passing through higher costs downstream.

ISM delivery times and prices paid in recoveries from recessions (institute for supply management sentiment surveys)
chart - transition - TRE 09/21 - chart 4

The labor market in flux

Thanks to the government’s response to the disruptions of the coronavirus, American workers have had more than a year to reconsider how they want to continue their employment. Although tracktherecovery.org reports that low-wage employment remains nearly 21% below the pre-pandemic levels of January 2020, and total job postings remain 11% lower, there is a segment of the labor force intent on not returning to the same old jobs at the same old salary.

You can see this in the signs posted at local restaurants looking for workers in every position. The shortage of labor is not as obvious, however, in the domestic supply chain.

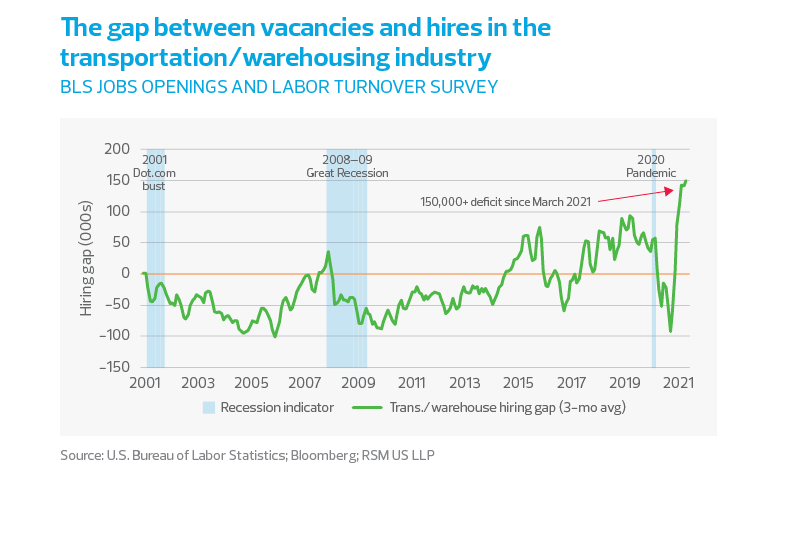
In the transportation and warehousing industries, which are essential to the just-in-time supply chain, hiring exceeded vacancies throughout the expansionary periods from 2001 to the end of 2014. From 2017 until the pandemic shutdown, however, vacancies exceeded hiring, indicating late-cycle opportunity for career changes as the unemployment rate pushed down to 3.5%.

The hiring gap in the transportation and warehousing industries—similar to the labor shortage at your local restaurant—suggests the difficulty of restaffing in the middle of a pandemic and the overriding issue of finding workers for difficult and low-wage employment.

Should we just expect to flip the switch and bring back the low-wage segments of the labor market when government subsidies end? Or has this once-in-a-lifetime pandemic given us a reason to rethink how we staff our train yards and warehouses, and why we expect restaurant, health care and school staffs to continue accepting low wages?
There is good reason to think that the shakeout of the labor market is not yet over as jobs go unfilled and workers demand higher wages.

The gap between vacanies and hires in the transportation/warehousing industry chart
chart - transition - TRE 09/21 - chart 5

The labor market over the long term

Beyond what we consider to be temporary supply-chain issues—which are hampering the immediate recovery from the pandemic—is the overriding issue of a shrinking labor force.

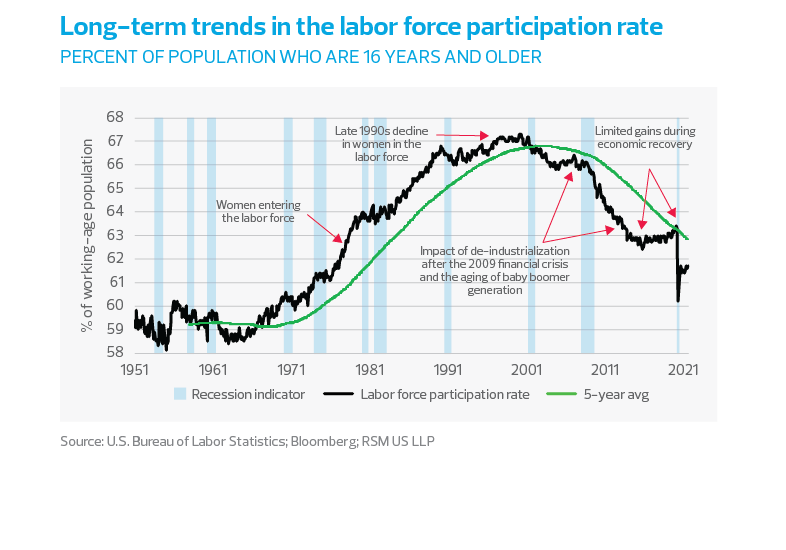
After a decades-long burst of energy sparked by women entering the labor force beginning in the late 1960s, the labor force participation rate has been on a downtrend since the 2001 dot.com recession. Much of that decline was likely because of a confluence of events that included the shrinking of the manufacturing sector, the peaking of women voluntarily joining the workforce, and the retirement of baby boomers.

But there are other factors pushing people to the sidelines. These likely include diminished prospects for earnings as service sector jobs became the dominant source of income. Why work for next to nothing at an otherwise unrewarding job? People tend to make rational decisions, and as the pandemic continues on, many are reconsidering the place of work in their lives and what is reasonable compensation for that work.

Disruptions in the labor market have uncovered dissatisfaction with working conditions and income that may accelerate investment in both automation and improvements in employment conditions.

The history of the employment-to-population ratio suggests that employment decisions are indeed rational, with the ratio moving higher during recovery periods as the demand for labor increases and wages are pressured higher to meet that demand.

Data show that the long-term increase in the employment-to-population ratio topped out in 2001, and managed to approach that level again only when the unemployment rate moved to 3.5% in 2019, at the end of a decade-long recovery following the 2008-2009 financial crisis.

This most recent shock to the economy, however, is like no other. Not since the Great Depression have so many people been out of work so quickly and for so long. And during that time, they were able to keep food on their table with a roof over their head for the most part.

It gave your barista serving coffee to higher-paid people or the waitress making $2.39 per hour plus tips time to think that maybe their position wasn’t the best long-term option. That seems to account for the gaps between job vacancies and hiring rates for restaurant workers and the transportation sector.

Long-term trends in the labor force participation rate
chart - transition - TRE 09/21 - chart 6

Is this a short-term phenomenon? Chances are the pandemic put a spotlight on a long-term trend toward employees creating their own opportunities for advancement. The U.S. census reported an extraordinary jump in the number of startups during the pandemic as measured by applications to open a business.

So if there is any economic good resulting from the pandemic, it may be that 300,000 new entrepreneurs make a good case for free enterprise. In addition, the growing call for better pay and working conditions may lead employers to partner with their employees, providing tuition benefits and flextime and immigration support, while their business earns goodwill and a loyal and productive workforce.

Demographic changes

Absent a productivity miracle, economic growth cannot happen without a growing population—it takes more people and new ideas to grow an economy. The alternative is stagnation of output and a paucity of ideas.

Recent data show an aging population and a declining birthrate, all without a sensible and robust effort to replace those missing from the labor force or to provide the next generation of innovators. These trends have the potential to flatten the U.S. economy.

An aging population: Workers who are 55 and older now comprise 30% of the population, up from 25% in 2011. That number will strain the social safety net and drain resources that might otherwise be directed at the prime-age working population.

At the same time, those 25 to 54 whom we consider as being in their prime working age are in decline, falling to 39% of the total population from 41% a decade ago. And their replacements, or those who are 24 and younger, have also dropped, to 31% of the total population, down from 34% in 2011.

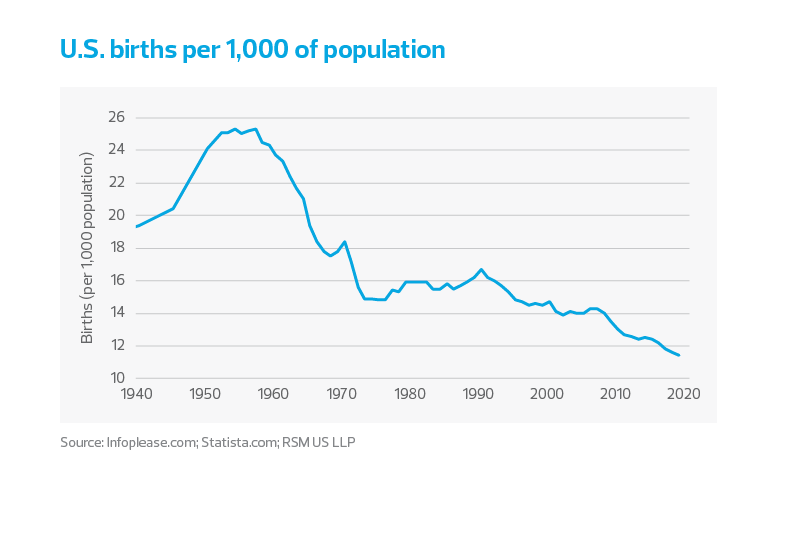
A decline in birthrate: Adding to this aging of the population is a declining birthrate. Last year was the sixth consecutive when the number of births in the U.S. declined, according to the National Center for Health Statistics—at an average rate of 2% per year.

This decline has become a generational issue. Hypothetically, it would take 2.1 births per woman for a given generation to replace itself. The provisional total fertility rate for the United States last year was only 1.6 births per woman, which is down 4% from the rate in 2019 for another record low. The report adds that the total fertility rate has generally been below replacement since 1971 and has consistently been below replacement since 2007.

An analysis of data from the Centers for Disease Control and Prevention by the Brookings Institution finds that “women are both delaying childbearing and having fewer total births,” which implies that “below replacement level fertility rates in the U.S. are probably here to stay for the foreseeable future.”

U.S. births per 1,000 of population chart
chart - transition - TRE 09/21 - chart 7

Immigration: There are essentially two ways a labor force can have the productivity to meet the needs of an economy: through a growing population or with increased automation.

Consider then the issues presented by a declining birthrate, an aging population and a restrictive immigration policy—all a recipe for limited growth and the potential for the “Japanification” of the U.S. economy.

A brief history of immigration shows that by the time the Johnson-Reed Act of 1924 imposed quotas on immigration from most parts of the world, many European families had already made their way to the United States.

The impact was a diminishing role of immigrants, with the percentage of foreign-born residents falling from 15% of the total U.S. population to less than 5% by the 1960s.

That restrictive legislation was changed by the Immigration and Nationality Act of 1965, which by 2019 had restored the presence of foreign-born residents to 14% of the total population.

Still, there has been a deceleration in the growth of the foreign-born population in recent years, according to data from the Migration Policy Institute. Note that these data include people residing in the United States both with and without authorization.

The RSM US Middle Market Business Index survey found that 76% of senior executives at middle market firms anticipated higher input prices by the surge in demand over the next six months.

Looking ahead

The shocks unleashed by the pandemic will almost certainly lead to a period of innovation. It is hard to imagine moving forward without significant immigration reform to address the clear challenges in the American labor market.

Moreover, as the global supply chain bottlenecks are unclogged and the economy eventually moves past the pandemic, demand will remain robust, and this will require a different mix of labor and technology.

For too long, basic reforms in the United States have been delayed. The infrastructure package recently approved by the Senate is one ray of hope that those reforms will be addressed.

Most important, as the churn in the labor market continues, this will result in what will be a rethinking of the relationship between society and work. In our estimation, the outcome is most likely to produce more sustainable changes necessary to address what will be a different economy once the pandemic eases.

RSM contributors

The Real Economy

Monthly economic report

A monthly economic report for middle market business leaders.

Industry outlooks

Industry-specific quarterly insights for the middle market.