The Real Economy

Forecasting interest rates in a post pandemic economy

Sep 30, 2020
#
Business strategy
Policy Economics COVID-19 The Real Economy

U.S. long-term interest rates have undergone a profound structural shift that is likely to keep yields at extremely low levels in the near to medium term.

Our RSM model of 10-year Treasury bond yields indicates downward pressure through the end of 2020, with the 10-year yield staying below 1% through 2025, pending an expected postelection boost in fiscal aid, stimulus and outlays on infrastructure. This is in line with the Bloomberg forward curve matrix, which implies a 1.28% yield on the 10-year in 2025.

If that boost does not materialize, then interest rates at the 10-year maturity will remain depressed near current levels somewhere between 0.5 and 0.7 with the risk of lower rates.

We anticipate the shock to the global economy from the pandemic will result in low levels of investment, and low expectations of inflation and growth. Regardless of who wins the election, policy in 2021 and beyond will need to focus on boosting productivity to increase growth, which currently is 1.8% and will fall to 1.5% in the following 20 years if the status quo is not changed.

Most important, our interest rate models imply that undercurrent economic conditions, debt accumulation does not provide the outsized risk to the economic outlook through an interest rate shock, inflation and lower growth than previously thought. For this reason, the United States has the fiscal space to adopt the required policy changes to increase productivity and long-term growth.

As the second figure indicates, the first shift of structure occurred in the early 1980s, marking the end of a chapter of industrialization and the concurrent growth of the consumer sector after World War II. After rising from rates of 2% to 3% during the early postwar economy of the 1950s, the yield on 10-year Treasury bonds increased to 15% by the height of stagflation in 1981.

U.S. 10-year treasury yield during and after recessions
*A couple of things to note in the figure. The yield on 10-year Treasurys has dropped during each recession in the postwar era, often after a late-cycle increase. After the recession, yields have continued to move lower until the economic recovery has taken hold. If there is an exception, it was in late 2018, when it became obvious that the U.S. trade policy was the catalyst for a global manufacturing recession. The U.S. economy was already treading water, and the bond market was anticipating that something would push it under. The trade war pushed the economy off the cliff, and the pandemic shoved it into the abyss.

The 1980s also marked the end of wide swings in the business cycle, shown in the third figure. After 1985, real gross domestic product growth exceeding 4% was a historical artifact, as were high interest rates. Long-term interest rates receded to the 2% to 3% range as the central banks of the world changed the focus of their policy to inflation-targeting.

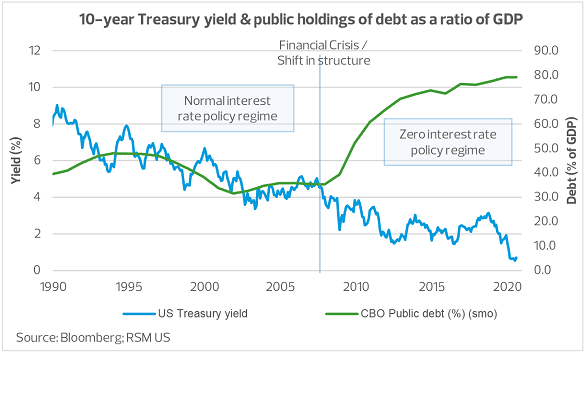
The second shift in structure occurred when the world’s central banks were forced to push policy rates to the zero bound during the financial crisis of 2007-09, and then to keep them there in order to facilitate commercial activity during an excruciatingly slow global economic recovery. The economist Lawrence Summers dubbed this period “secular stagnation,” with GDP growth rarely moving above 2% and with commodity prices dropping due to lack of demand (and changes in technology with regard to the oil market). The result has been to push long-term interest rates below 2%.

Now, simultaneous threats to global growth from the U.S. trade war and the pandemic have pushed inflation expectations and long-term interest rates tumbling, compressing the yield curve such that 10-year yields are mere basis points above short-term rates.

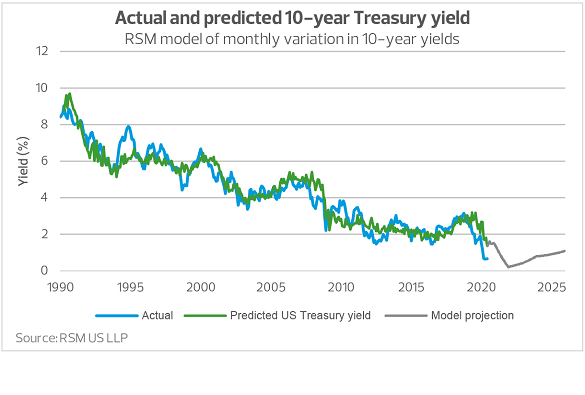
So we find ourselves in a post-inflation world, attempting to project the trend in interest rates that have nowhere to go but sideways or up. (Unless, of course, the economy was to reach the point where the Federal Reserve adopts the negative interest rate policies of the European Central Bank or the Bank of Japan.)

Where do we go from here? Let’s start with some interest rate basics.

Decomposition of interest rates

Long-term interest rates can be viewed as the present value of, first, expectations for the path of short-term rates over the life of the bond; and second, a risk premium to account for events that might cause those short-term rates to deviate from that path. For example, if the overnight interest rate were 3% (at an annualized rate), and you thought that no earth-shattering events would occur over the next 12 months that would affect the rate of inflation, then you would be willing to buy or sell a 12-month bond that was priced to yield a 3% return on your investment.

If you thought that there was a risk of runaway inflation sometime within the next 12 months and that short-term rates would need to be hiked, then you might require a higher rate of return on that bond (which would cover the increase in inflation).

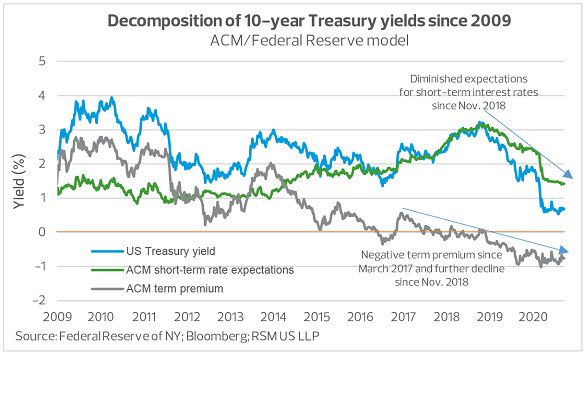
Three economists, Tobias Adrian, Richard K. Crump and Emanuel Moench estimated those two components of interest rates in a paper for the Federal Reserve Bank of New York.

As shown in the figure below, the yield on a 10-year bond is the sum of expectations for short-term rates and a risk premium (referred to as the “term premium”) to compensate for potential deviations from that rate over the life of the bond.

It is almost always guaranteed that a catastrophic event will occur over the course of the next 10 years, 20 years or 30 years that will dash all of your expectations. For instance, in just the past two decades, there have been three equity-market crashes to go along with the three recessions, two wars, and one and perhaps two political crises.

At the present, expectations are that short-term rates over the next 10 years will average 1.45%, and that investors will require a risk premium of negative 0.75%, the sum of which results in a yield of 0.7% on a 10-year bond.

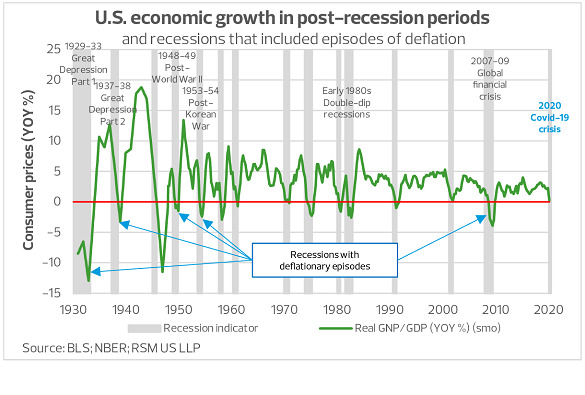
We should note that the negative term premium is the result of apprehension over the prospects for the economy and the risk of deflation. The term premium has been negative since March 2017, in anticipation of the damage to the global economy resulting from the U.S. trade war (and now the pandemic), and the risk that the Fed will be unable to contain deflationary pressures should demand drop to depression-era levels.

Modeling interest rates

Is there some way to make projections for those two components of long-term interest rates?

The economist Michael Rosenberg has identified market variables that form the expectations component and the term premium component. Accordingly, the expectations component can be further broken down into:

  1. The real interest rate
  2. Expectations of the inflation rate

And the term premium component can be broken down into:

  1. The real risk premium
  2. The inflation risk premium

Rather than use projections built into prices of financial assets, we have found economic variables that explain the variation in the yield on 10-year Treasury bonds—and for which we can make reasonable projections based on the direction of monetary and fiscal policy. We have used regression analysis to create the RSM long-term interest rate model.

The model consists of four variables that approximate components of interest rates and the supply and demand for long-term securities:

  1. The natural rate of interest, which approximates the real rate of return that investors require for a short-term investment
  2. Expectations of inflation over the life of the bond
  3. The risk of a bond market investment
  4. The perception of the cost of financing the government debt

An ordinary least-squares regression was run using monthly data from April 1990 to June 2020, the period when data for all variables was available. In our estimation, this best approximates the domestic and global economies we now have. While we acknowledge that the identification of the natural rate of interest is difficult, it is necessary in identifying the direction of short- and long-term interest rates, and we are comfortable with this approach and the data used here.

The model and its parameters are listed in the table below, followed by a discussion of the variables and our projections that form the basis for predicting the trend in 10-year yields.


The natural rate of interest

We are using the Laubach-Williams estimates of the natural rate of interest, available through the Federal Reserve Bank of New York, where John C. Williams is now president. (The late Thomas Laubach was co-author at the San Francisco Fed.) “Their approach defines r-star as the real short-term interest rate expected to prevail when an economy is at full strength and inflation is stable,” the New York Fed writes on its website. Estimates of r-star are based on real GDP growth, inflation and the federal funds rate.

We use the Laubach-Williams natural rate as the real return on investment required by investors. In a risk-free world, nominal interest rates (such as 10-year bond yields) would be equal to the natural rate plus inflation expectations over the life of the bond. The Laubach-Williams natural rate has a correlation coefficient of 0.85 with 10-year bond yields, and 0.78 with respect to short-term rate expectations.

At present, the natural rate dropped to 0.03% as the pandemic has closed down the economy and inflation refuses to move higher toward the Fed’s 2% inflation target. We have made the assumption that r-star will mean revert from its crisis level by the end of 2025, if and when a vaccine is discovered.

Inflation expectations

Inflation expectations form the second leg of interest rate determination, which when added to the natural real rate as we discussed, would seemingly provide an adequate basis for an estimate of 10-year yields.

There are several potential sources for inflation expectations, including economist forecasts, the Federal Reserve Bank of Philadelphia’s ATSIX series, and the University of Michigan’s survey of inflation expectations for the next five to 10 years. The ATSIX series does not begin until 1998, and the UMich series has a higher correlation coefficient (0.77) than the ATSIX (0.69), both of which made the decision to use survey-based variables easier to make. And after all, we are talking about expectations for inflation, and it is investor expectations that really matter.

We are using the Fed’s forecasts of inflation found in the Federal Open Market Committee’s Summary of Economic Projections. The FOMC has PCE inflation, or personal consumption expenditures, moving from 1.2% in 2020 to 1.7%, 1.8% and 2.0% in the next three years toward 2.5% in the long run as the Fed allows inflation to (hopefully) move above its 2% central target in order to stimulate growth and to balance out the current low-growth and low-inflation episode.

Bond market risk

The MOVE Index of Treasury bond market volatility is the generally accepted measure of underlying risk built into the fixed-income market. It is a weighted average of implied volatilities on 2-, 5-, 10- and 30-year Treasury bond options, and is an indicator of future risk in holding a Treasury bond.

The figure below shows a decelerating level of bond market risk since the 2007-09 financial crisis, with the exception of the early days of the coronavirus and the March 2020 equity market collapse, which spilled over into all asset markets.

Because we expect further compression of the yield curve caused by the trade war and the pandemic, and because we expect at least another year for a vaccine to be universally available, we are projecting the MOVE Index to revert to its 2011-19 average level of 69 from its current level of 47 by 2025.

The MOVE Index is sufficiently correlated (a correlation coefficient of 0.61) to the term premium, allowing it to be considered for our model. Within the model, the MOVE Index does have a significant regression coefficient, though perhaps because of the nature of market moves, it appears to have the weakest relationship to interest-rate levels.

Perceptions of the cost of new government debt

recent paper, “Fiscal effects of COVID-19” by Alan J. Auerbach, William G. Gale, Byron Lutz and Louise Sheiner, says, “Because low interest rates create ‘breathing room’ for fiscal policy, we do not see the large short-run debt accumulation … as necessitating any immediate offsetting response.” The paper cautions, however, that the already large accumulation of debt since 2000 and beyond will need attention.

In fact, the nonpartisan Congressional Budget Office estimates that public debt will soon breach 100% of GDP—a level that draws unenviable comparison to Japan’s ability and willingness to issue debt—and will move toward 107% by 2024.

The figure below shows that 10-year yields were responsive to issuance of public debt (relative to GDP), moving lower from 1995 to 2002 when the debt ratio was also moving lower, and then rising from 2002 until 2007 when the debt ratio also moved higher. This is a short time frame, but the behavior of interest rates relative to the amount of debt during that period seems to make sense.

From late 2007 onward, however, there seems to be something else involved in the setting of interest rates. The debt ratio began its next phase of climbing higher and rates continued to move counterintuitively lower.

That something else is the market’s perception that the cost of financing new debt would be virtually zero, given the advent of extremely low interest rates. These perceptions are anchored by forward guidance from the Fed that it would not only keep short-term interest rates at the zero bound, but would also purchase long-term securities to pressure long-term interest rates lower.

So we’ve created a new variable that we’ve labeled “Perceptions of the cost of new government debt” and which we define as the product of the federal funds rate and public holdings of debt. As expected and because the federal funds rate affects interest rates out along the yield curve, the variable has a 0.79 correlation with 10-year bond yields for the period of 1990 to 2000. We show the relationship between 10-year yields and the perception variable in the figure below.

Despite the somewhat circular relationship, we would argue that the variable encapsulates the recent rationalization by policymakers that debt accumulation is no longer a threat to the economy. After all, despite being scoffed at for decades, Japan continues to thrive at low rates of inflation despite its high level of debt. But that might also be due to the yen’s intrinsic value in the currency market. Evidently, the bond market has wholeheartedly accepted the flip-flop.

RSM contributors

The Real Economy

Monthly economic report

A monthly economic report for middle market business leaders.

Industry outlooks

Industry-specific quarterly insights for the middle market.