Recessions carry with them long-term direct and indirect costs to the labor force and to the potential growth of the economy.
Key takeaways
During past recessions, the unemployed population fell behind in terms of skills, with the labor force suffering unrecoverable losses in income.
The upshot is to expect a years-long recovery period if the economy sinks into recession while policymakers and businesses rethink ways to maintain output and future growth.
The U.S economy has yet to slip into a recession despite two consecutive negative quarters of growth. There is a difference, after all, between the conventional definition of a recession and the formal definition of one. Put simply, recession requires more than just two quarters of contraction.
In addition, our proprietary RSM US Middle Market Business Index improved to 138.5 in the third quarter, a 7.3-point increase from the second quarter. That strongly implies a real economy that continues to expand even in the midst of inflation, interest rate increases and the lingering impact of the pandemic.
RSM US Middle Market Business Index
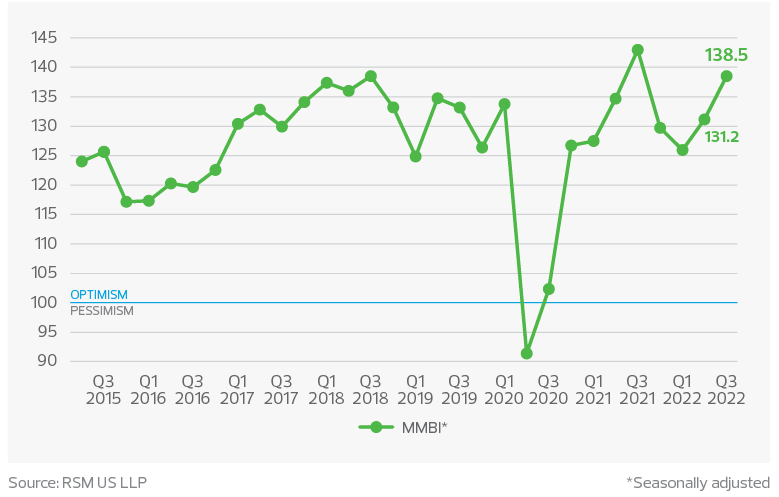
That improvement came about because businesses have been able to pass along price increases to customers—71% of executives in the MMBI survey reported doing so—while revenues and net earnings remained stout.
This is not to say that firms will be able to do that indefinitely. They will not. Yet for now, businesses have been able to absorb the shocks without a significant downturn in hiring, income, industrial production or sales.
A clear majority of executives in our survey said they intended to hire more workers, pay them more and invest in improved productivity, all while expecting revenues and net earnings to increase.
For this reason, we do not expect a recession for the remainder of 2022 despite a 45% probability of one hitting the domestic economy over the next 12 months.
But many executives remain concerned about the prospect of a recession, so in this month’s issue of The Real Economy, we spell out what a recession will look like and what to look for.
We present useful metrics to identify whether a recession has started and analyze critical industrial ecosystems to illustrate the variation in growth, employment and inflation across the underlying economy.
Why is the economy not in a recession?
From our vantage point, the economy has not slipped into recession. During the first seven months of the year, 3.4 million jobs were created and the unemployment rate—taken out to three decimals—fell to 3.458%, a 50-year low. More individuals are working now than before the pandemic, with real wages up 0.5% despite an 8.5% inflation rate.
In addition, our own RSM US Supply Chain Index indicates that the snarled domestic chains are normalizing. In July, the index was above neutral for the first time in nearly three years on the back of the strong rebound in inventories and capacity utilization. This unsnarling of supply chains should on the margin dampen inflation and bolster output in the second half of the year, when we expect growth to advance by 1.5%.
RSM US Supply Chain Index*
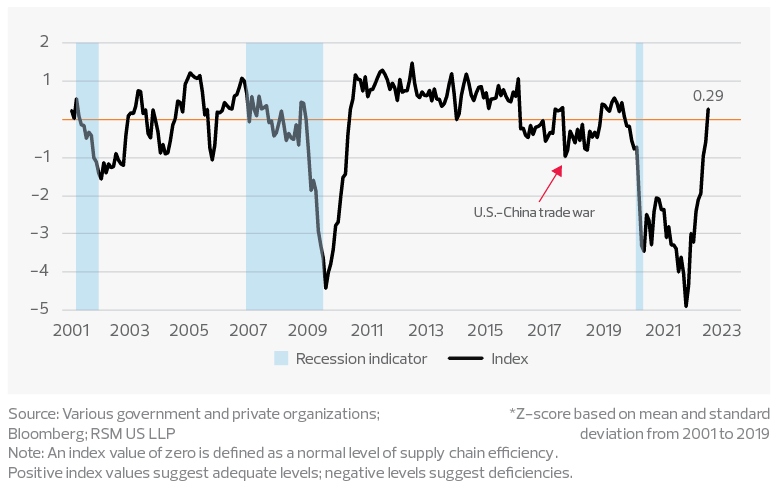
With COVID-19 mostly in retreat and supply chain bottlenecks easing, we should expect substantial relief coming from the supply-induced components of inflation, which account for about 35% of year-over-year inflation, according to our estimate.
Our index, however, does not capture the issues surrounding the housing deficit, a sticky component of inflation. On top of the housing shortage, the labor market remains tight as the labor supply is slow to come back to its pre-pandemic level, reflected in the stagnant labor force participation rate in recent months.
That should keep the Federal Reserve on its course to raising rates this year—we think the federal funds policy rate will be lifted to 4% before the end of 2022—to combat elevated inflation, which is still far from the long-term target of 2%.
While our base case shows inflation will continue to retreat, we expect the annual inflation rate will most likely fall to around 3% by the end of next year and remain above the 2% target rate for a while.
What we can expect if the economy slips into recession
A recession brings about labor market slack, diminished production and subsequent losses of income and sales.
Note that a recession entails an extended period of decline in economic activity. That’s not to be confused with deceleration of growth that typically occurs amid the ebb and flow of a business cycle.
The final descent of a business cycle into recession is usually brought on by an event like an energy-supply shock or a financial crisis that affects the broader economy.
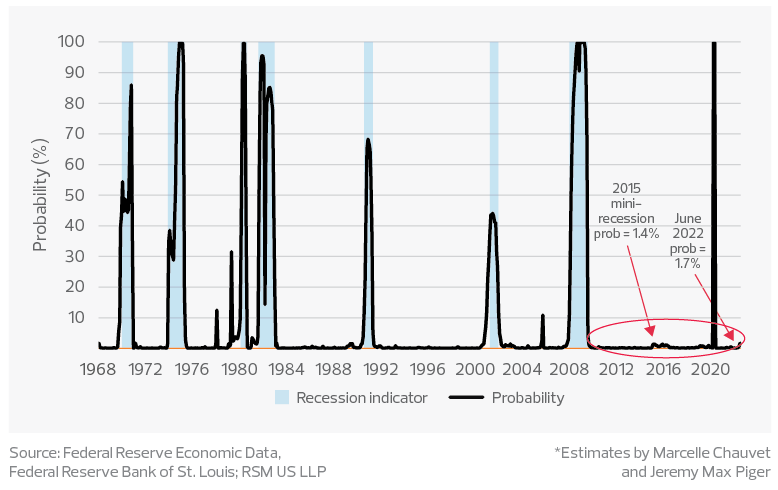
Absent such a shock, our forecasting model estimates a 1.7% probability of a U.S. recession as of June 2022, which is different from our probability estimate of 45% over the next 12 months.
Given long and variable lags in the data and the unique impact of the energy shocks and geopolitical tensions still coursing through the economy, it will be a while before a recession hits.
The current estimate of 1.7% is based on an econometric model developed after the early-1990s recession that continues to predict turning points in the economy and the ongoing status of the business cycle.
The authors, Marcelle Chauvet and Jeremy Max Piger, applied their model to four monthly coincident variables that correspond to the health of the economy. These indicators can be followed in the mainstream press and in our articles, and they offer insight into the depth and duration of the recession:
- Nonfarm payrolls
- Industrial production
- Real personal income, excluding transfer payments
- Real manufacturing and trade sales
We can use their work identifying the turning point in a business cycle to understand what to expect during periods of recession.
U.S. recession probabilities*
Nonfarm payrolls
If a recession is the absence of growth or an outright decline, then a consistent drop in job creation below normal levels would signal a recession.
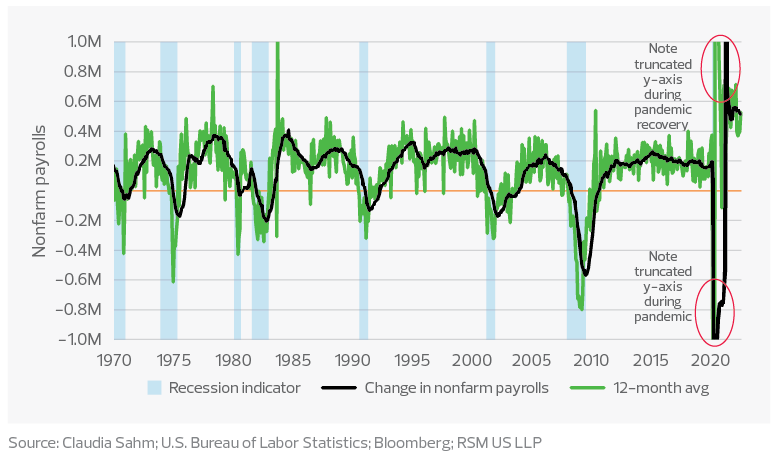
A rule of thumb in normal times—borrowing from the Sahm Rule for unemployment—is that a consistent drop in the monthly change in payroll employees below the 12-month average signals a descent into recession, while negative values of job creation characterize an economy in recession.
Over the past decade, job creation mean-reverted to around 200,000 new jobs per month. In the past 12 months, the monthly increase in nonfarm payrolls has averaged 512,000. So, job creation remains in the post-pandemic stratosphere, which is a good sign but makes comparisons to other business cycles difficult.
Nonetheless, the lack of job creation would normally indicate slack in the labor market, resulting in moderated pressure on wage growth. But in an environment distorted by a limited supply of labor, wages would be expected to remain somewhat sticky, with investments in automation pointing to higher wages for a smaller and more-qualified labor force and the lack of immigration pointing to upward pressure on wages in low-income occupations.
Job creation during recessions
Industrial production
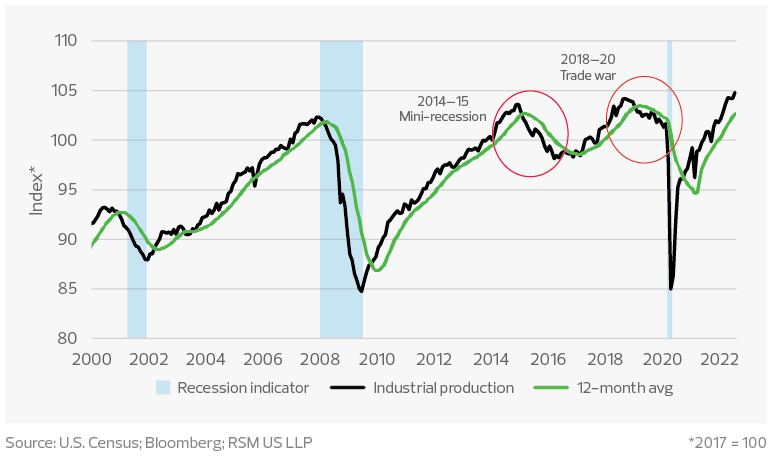
The Chauvet-Piger model looks at the index of industrial production. In the decade-long business cycle after the Great Recession, two downturns in the industrial production index signaled distress.
The first coincided with the commodity-price collapse of 2014, which led into the so-called 2014-15 mini-recession. The second coincided with the 2018 onset of the trade war that led into the 2019-20 global manufacturing recession.
In the first instance, the price of energy plummeted, allowing consumer spending to continue. In the second instance, the pandemic pushed the economy into a sharp recession.
Industrial production index and the business cycle
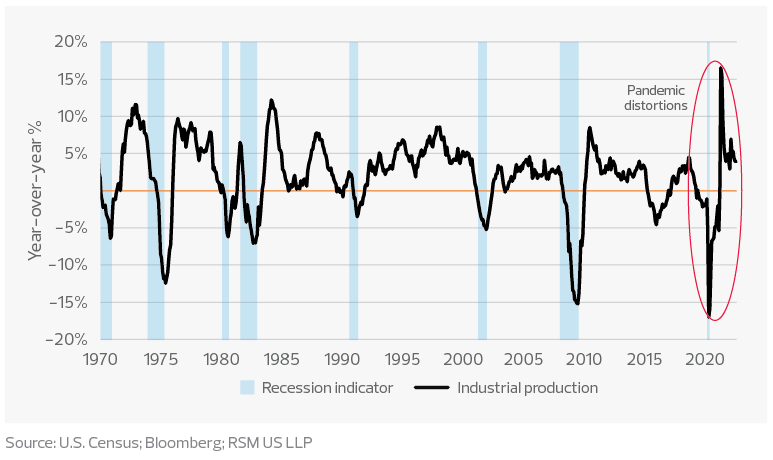
The trends in the growth rate of industrial production coincide with the direction of the overall economy, with the presence of negative growth of industrial production signaling the sudden start of a recession. The reemergence of growth of industrial production (relative to months of the previous year) coincides with the end of the recession.
A rule of thumb is that drops in industrial production of more than 5% signal a more severe and longer recession than, for instance, the shallow recession of the early 1990s.
Industrial production growth during recessions
Real personal income
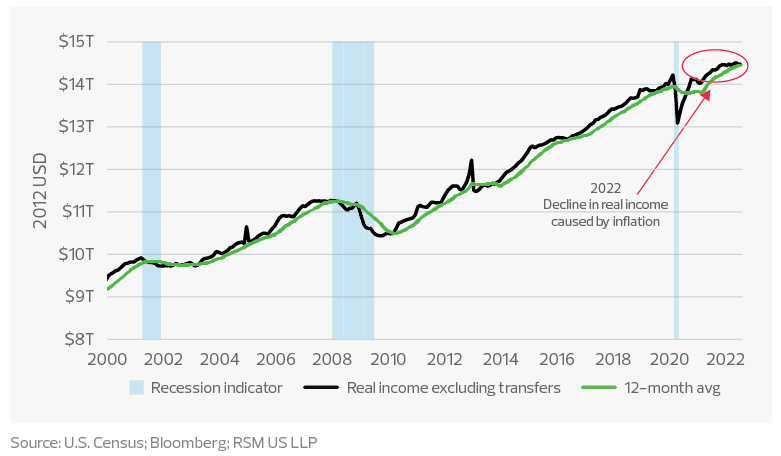
Real personal income is a measure of both the availability of employment and the ability to consume goods and services, given the effect of inflation on household balance sheets. As would be expected, the drop in the monthly measure of real income below its 12-month moving average occurs at the outset of a recession as employment opportunities decrease, and then continues over the duration of the recession.
In the current period, real income growth has decelerated to less than 1% relative to June 2021 as inflation has accelerated to an 8.5% yearly rate. That explains the Fed’s focus on preventing further deterioration in the purchasing power of wages.
Real income excluding government transfers during recessions
Real manufacturing and trade sales
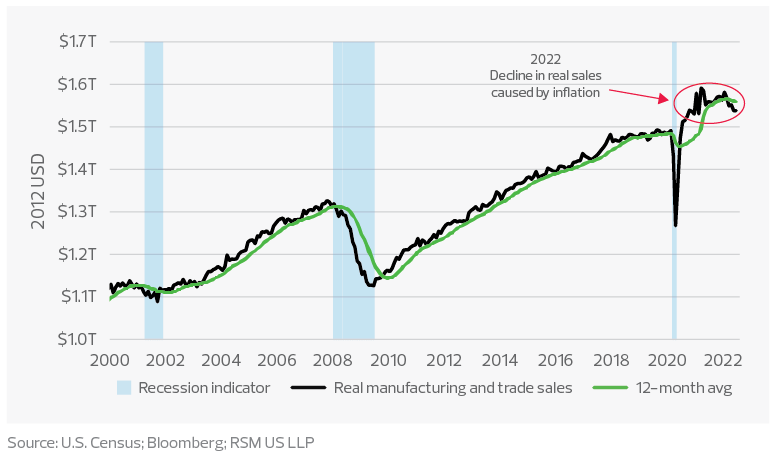
Just as inflation is limiting consumer buying power, it is also eating into sales and revenues, threatening the recovery in the business sector. While nominal manufacturing and trade sales have been growing at a 15% yearly rate over the past six months, sales growth in inflation-adjusted terms has been negative over the past four months.
As would be expected, manufacturing and trade sales in real terms drop during recessions, with sales growth hitting bottom near the end of the recession. This goes along with losses of employment and the ripple effects of increased uncertainty as households refrain from spending and businesses pare back.
Real manufacturing and trade sales during recessions
Calling a recession
The Chauvet-Piger model, however, uses only four out of six variables spelled out by the Business Cycle Dating Committee of the National Bureau of Economic Research to identify official recession dates. The two other variables are the employment level, as determined from a household survey, and real personal spending.
U.S. recession tracker: Jobs and industrial production temper recession fear*
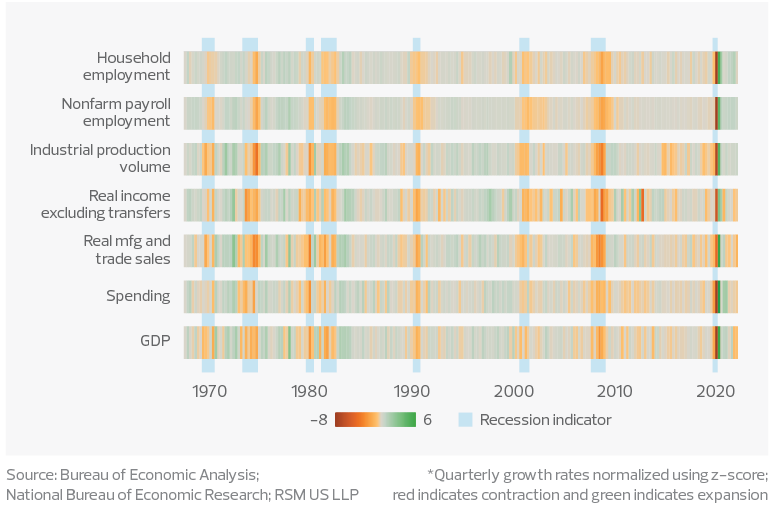
Together with gross domestic product data, we can develop a tracker for the growth rates of all six variables in a heat map. All variables are normalized using z-scores, with scores under zero indicating activities lower than the long-term normal level while scores above zero indicate activities stronger than the long-term normal level.
Benchmarking against official recession dates in the past, the heat map shows just how consistent the NBER has been in calling a recession, which it defines as “a significant decline in economic activity that is spread across the economy and that lasts more than a few months.” In each of the past eight recessions, the downturns were officially dated only when all variables showed significant declines.
During the first six months of this year, three out of the six variables—job gains from the household survey and payroll report, and industrial production volume—continued to expand, countering any notion that the U.S. economy was in a recession.
The takeaway
Recessions carry with them long-term direct and indirect costs to the labor force and to the potential growth of the economy.
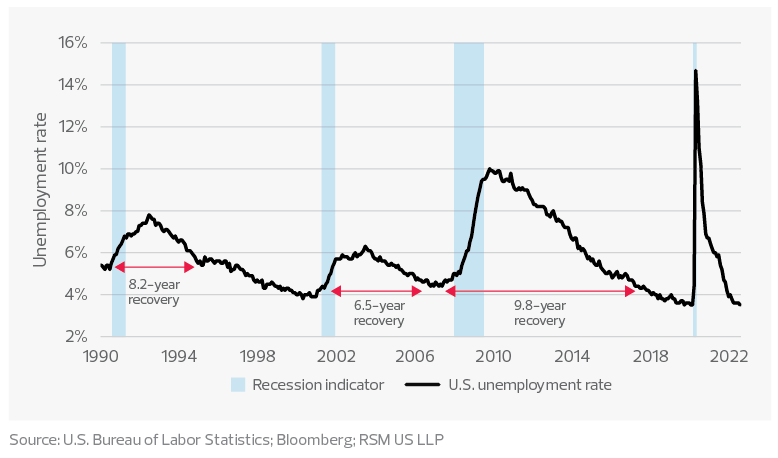
After the shallow recession in the early 1990s, it took 8.2 years for the labor force to return to its pre-recession unemployment rate of 5%, which incidentally corresponded to rule of thumb estimates of the equilibrium rate of unemployment at the time.
After the shallow recession in the early 2000s, it took 6.5 years to reach the pre-recession unemployment rate, which in that case was 4.4%. And then after the Great Recession, it took 9.8 years for unemployment to drop back to the 4.4% rate, which matches the latest estimates of the equilibrium rate.
During those years, the unemployed population fell behind in terms of skills, with the labor force suffering unrecoverable losses in income, while businesses suffered losses in productivity, competitiveness and revenue.
The upshot is to expect a years-long recovery period if the economy sinks into recession while policymakers and businesses rethink ways to maintain output and future growth.
U.S. unemployment rate during recessions and number of months to return to pre-recession rate
RSM contributors
More from The Real Economy
The Real Economy
Monthly economic report
A monthly economic report for middle market business leaders.
Industry outlooks
Industry-specific quarterly insights for the middle market.


