After a decade of the longest expansion in American history, the economy is entering a fraught new phase, one characterized by whipsaw changes in trade policy and a highly volatile geopolitical environment. The result is a chill on both capital investment and household spending as businesses and consumers search for stability. Call it the “Age of Anxiety.”
The shift is being driven by what we call the uncertainty tax: When businesses are confronted with continuing radical shifts in trade policy, they become reluctant to invest in equipment, software and intellectual property—the kind of spending that will enhance productivity in the long term. That drop-off inevitably leads to greater volatility in asset prices, along with declines in consumption, and ultimately, employment.
The result is the U.S. economy is caught in a trap—one entirely of its own making. The conundrum is occurring just as the positive effects of the tax cuts of 2017 and higher government spending begin to wear off.
The economic data tells the story: Growth is slowing, investment is declining and export markets are shrinking. The climate could get worse, given the instability in domestic political environment and the upcoming presidential election. There is a risk that this uncertainty will increase into the first half of 2020.
This does not mean that a recession is on the horizon—it would take an intensification of the trade war or a large exogenous shock to cause a recession. But we do expect growth in the first half of 2020 to arrive around a soft 1%, a notable deceleration from the 3% rate of 2018.
Measuring uncertainty
It’s hard to escape the anxiety that looms over the economy—stories of political turmoil and shifting stances on trade dominate the news cycle. Uncertainty is reflected in the drop in exports and corporate capital expenditures, but there are other measures as well.

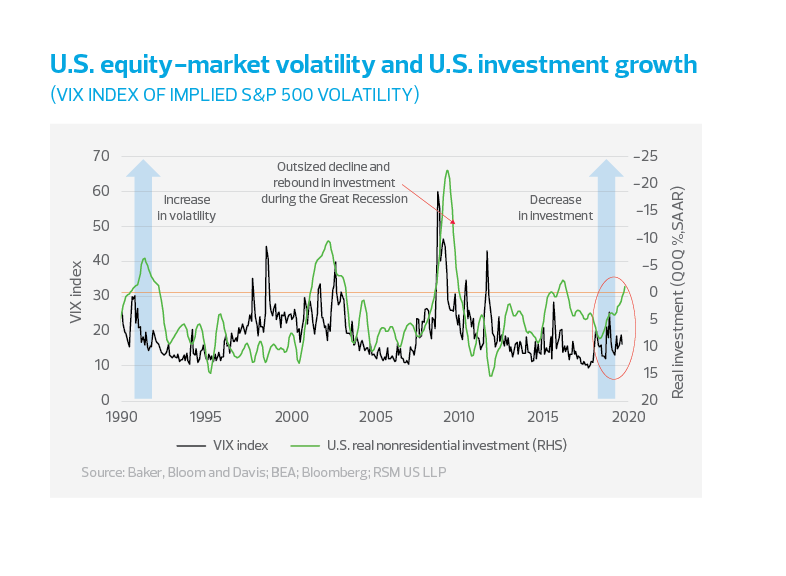
One example is the CBOE Volatility Index, or VIX, which measures equity-market volatility and is more commonly known as the “fear index.” Under this measure, low volatility suggests a stable environment for investment and consumption and high volatility indicates greater risk for spending outcomes.
The perceived risk in the equity market has at times been a leading indicator of the rate of growth in investments.
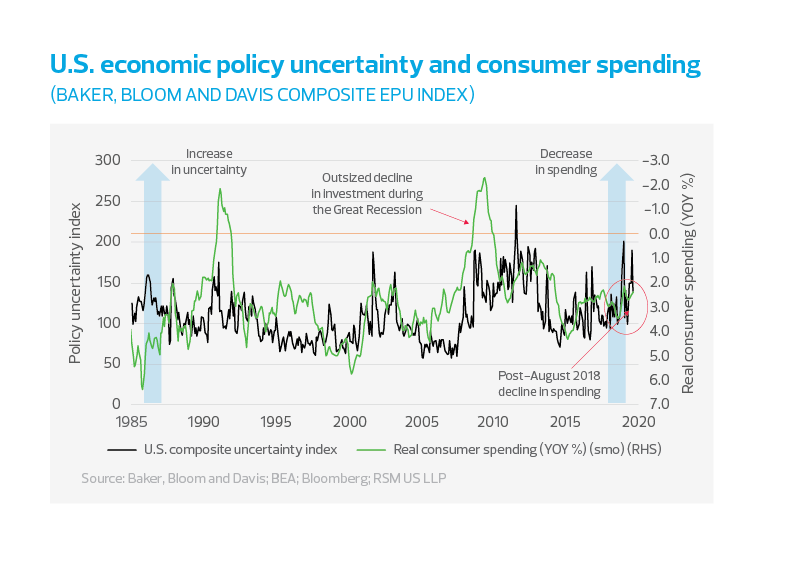
Another measure of uncertainty was introduced in a widely circulated paper at the National Bureau of Economic Research, written by the economists Scott R. Baker, Nicholas Bloom and Steven J. Davis. It traces the effect of conflicts and major events of the past 35 years.

Baker, Bloom and Davis don’t limit their measure of uncertainty to the broader economy; they also identify its specific causes, from the recent American saberrattling with North Korea to the United States bailing out of the Trans-Pacific Partnership to the beginning of global trade tensions. To be sure, there have been moments of uncertainty throughout the years, but we should be aware of periods where extraordinary events have led to elevated levels of stress.

Uncertainty and business investment
The result of these shocks ultimately affects economic decisions. That’s because businesses need some sense of stability in economic and trade policy if they are to make significant long-term investments.
As Baker, Bloom and Davis wrote:
“Evidence that policy uncertainty raises stock price volatility and lowers investment rates and employment growth rates for firms in government-exposed sectors like defense, healthcare and construction, and that these effects are large enough to matter for aggregate investment, employment and output.”

Each of the modern-era recessions has been accompanied by a sharp decline in investment spending. In the period immediately after a recession—and depending on the depth and duration of the downturn— investment spikes up relative to the recession level before moderating back to normal rates of increase.
The current economic recovery is noteworthy in that investment growth took longer to recuperate after the 2007-09 Great Recession, as would be expected after a financial shock, but seems to be more symptomatic of the offshoring of manufacturing that accelerated in 2009 in the depths of the crisis.

Investment growth turned negative during the minirecession of 2015-16 that was induced by the collapse in commodity prices. Despite the corporate tax cut in December 2017, nonresidential investment growth was negative again in the second quarter of 2019 (relative to the first quarter) and could very well become a drag on total gross domestic product growth.
Investment is dependent on perceptions of uncertainty and risk. The decline in domestic capital expenditures by business in the current economic cycle clearly reflects the mitigation of risk and can be observed in the transfer of production to low-cost centers outside of the United States. Consumers, however, cannot offshore their expenses.
Uncertainty and household investment and spending
While business investment accelerated from early 2016 through the second quarter of 2018, residential investment has been decelerating since 2013. There could be factors other than uncertainty causing the latest decline in residential investment. For one, we are seeing major demographic shifts in housing preferences as millennials and aging baby boomers increasingly live in cities. In addition, overheated markets in some areas of the country have pushed home purchases beyond the reach of many consumers.

Nevertheless, the current economic recovery is noteworthy in that residential investment growth took longer to recuperate after the 2007-09 Great Recession—as would be expected after a housing induced financial shock—and there were apparently no trickle-down effects from the 2017 tax cuts. Residential investment has been negative throughout 2018-19 on a quarterly basis.

Still, there is no getting around the elephant in the room— the increasing anxiety that consumers are feeling. The Baker, Bloom and Davis data show an across-the-board increase in policy uncertainty in 2019, and it is unlikely that households would be unaware of its existence if only at the most basic of levels—like the rising cost of household products. And while there are baseline amounts of household consumption—rent, food, utilities and clothing—spending becomes more discretionary during periods of stress. Clearly, the two most recent downward spikes in consumer spending occurred during bouts over trade between the United States and China.

Surveying the surveys
How can we measure consumer anxiety? There are three major surveys of consumer sentiment: The Conference Board, the University of Michigan Consumer Surveys and Bloomberg. The survey results are reported as diffusion indices with the percentage of negative responses subtracted from the percentage of positive responses. And while the overall trends have been consistent among the surveys, the figure below indicates that the Michigan survey has diverged from the trend prior to 2001 and now since mid-2017.
These are surveys with different questions, different sample sizes and different scheduling, so it is logical for there to be variations from time to time. To capture all the information, we have constructed a composite, poll-of-polls index that we will use in the discussion that follows.

Our poll-of-polls consumer confidence index indicates that consumer sentiment might have topped out in early 2018 at 1.5 standard deviations above normal levels of sentiment, which coincides with the realization that the threats to trade were becoming policy. And as the figures below suggest, the topping out of consumer sentiment might have something to do with the maturation of the labor market and the unemployment rate reaching its peacetime limit, all within the backdrop of real disposable income trending downward since the second quarter of 2018.


The downturn may not be confined to manufacturing
We are already in a global manufacturing recession, with U.S. trade policy affecting Chinese purchases of German machinery. But the ripple effects did not end there. Diminished U.S. business investment, limited employment opportunities and a recently more cautious consumer have led to a declining trend in disposable income. Is it any wonder that U.S. consumer sentiment has stalled and households have begun to pull back on spending?

Optimists might point to the robust 3% year-over-year growth of household spending in the second quarter of 2019 as a barometer of household resilience. But the damage to investment processes brought about by the upsurge in uncertainty has the potential for mediumand long-term effects on economic growth, wages and consumption decisions.

UNCERTAINTY’S ECONOMIC TOLL THROUGH THE DECADES
There were huge spikes in uncertainty in the first and last years of George W. Bush’s presidency because of the Sept. 11 attacks in 2001, and then the Wall Street meltdown in 2008.
Policy uncertainty moderated during Barack Obama’s first year in office, but by 2010, there were outsized trade concerns in the immediate post-crisis period. In the last year of Obama’s second term, global trade was again a concern as an oil glut and commodity-price decline undermined the value of global trade and its effect on global growth. National security also became a concern in 2014-16, as ISIS in Iraq and civil war in Syria threatened the Middle East status quo.
By late 2016, North Korea’s missile testing intensified and became the first existential threat to the United States since the 9/11 attacks. And by the start of the Trump administration in 2017, trade concerns became dominant as the administration bailed out of the Trans-Pacific Partnership, followed by U.S. tariff threats, the U.K. drawing closer to leaving the European Common Market, and Germany starting its economic decline. As of September 2019, all categories identified by Baker, Bloom and Davis were indicating more uncertainty than in 2018.


