The Real Economy

The price of war: Risks around the inflation outlook

June 07, 2022
#
Economics The Real Economy

While we expect the annual inflation rate to peak this quarter as the comparisons to the lower levels of a year ago wear off, the risk of rising prices will remain as the twin shocks of the Russia-Ukraine war and China’s coronavirus shutdowns endure.

These price shocks will have the biggest effect on lower-income households, reducing their ability to pay for the living essentials, whether it’s driving to work, heating and cooling a home, or putting food on the table.

But the price shocks will also lead to reduced discretionary spending, which will, in turn, cause a slowdown in economic growth that will affect all income classes and businesses.

Already, the impact has been significant. In March, food prices increased by 1% over February, and energy prices increased by 11%. The so-called core inflation rate, the items excluding food and energy, increased by 0.3% as rents increased by 0.5%.

The overall consumer price index increased by 1.24% for the month, which over 12 months would amount to an inflation rate of around 15%.

Although we do not anticipate that pace will continue, one has to note the risks around the outlook linked to idiosyncratic factors beyond the control of policymakers and not linked to domestic economic fundamentals.

With the European Union's partial ban on Russian oil, we could very well see another test of highs in oil, gasoline and energy prices.

Such price increases would upset the evolving consensus that inflation has peaked and could set the stage for a premature end of the business cycle.

The Federal Reserve can do little about the war or the pandemic in China. So its task is to tamp down embedded inflation expectations, which, if they increase, would most likely lead to hoarding—as we saw in the early months of the pandemic—and a dramatic tightening of monetary and financial conditions.

As in the 1980s, an increase in interest rates to levels needed to end 15% inflation would cause a severe drop in demand and a deep recession, sending millions out of work and defeating the Fed’s mandate for full and equitable employment.

Is a recession inevitable? Can the Fed engineer a soft landing for the economy and bring about price stability?

We think the underlying economy is strong, with businesses taking steps to navigate around supply chain roadblocks and improve productivity. In addition, we expect infrastructure spending to kick in at the end of the year despite further political roadblocks.

Finally, we think that the monetary authorities have the flexibility to adapt to rapidly changing conditions, whether in the rate of economic growth or the rate of inflation. There have certainly been enough disturbances and shocks over the past five years to believe that.

So we remain optimistic, but with our eyes wide-open to the risks.

How did inflation surge so quickly?

Before the war in Ukraine, the focus regarding inflation had been on select items in short supply—as a result of supply chain issues—and the increase in housing costs that account for nearly a third of the overall cost of living.

Many of the increases in product costs were expected to be transitory—as, for example, the skyrocketing cost of used cars that is now decelerating. And with the recovery taking shape, expectations were for the Fed to gradually raise interest rates, which would cool an overheating housing market. At the same time, the end of pandemic income assistance programs and the reduction in savings would moderate consumer demand.

Given the extraordinary circumstances of the pandemic and the confidence that the monetary authorities among the developed economies would take reasonable action to constrain inflation, expectations for inflation remained low.

At the end of 2020, which marked the rollout of the vaccines and the acceleration of the recovery, the inflation rate was expected to remain close to the Fed’s 2% target.
That was after years of disinflation and a consumer sector accustomed to the availability of cheap goods and gasoline.

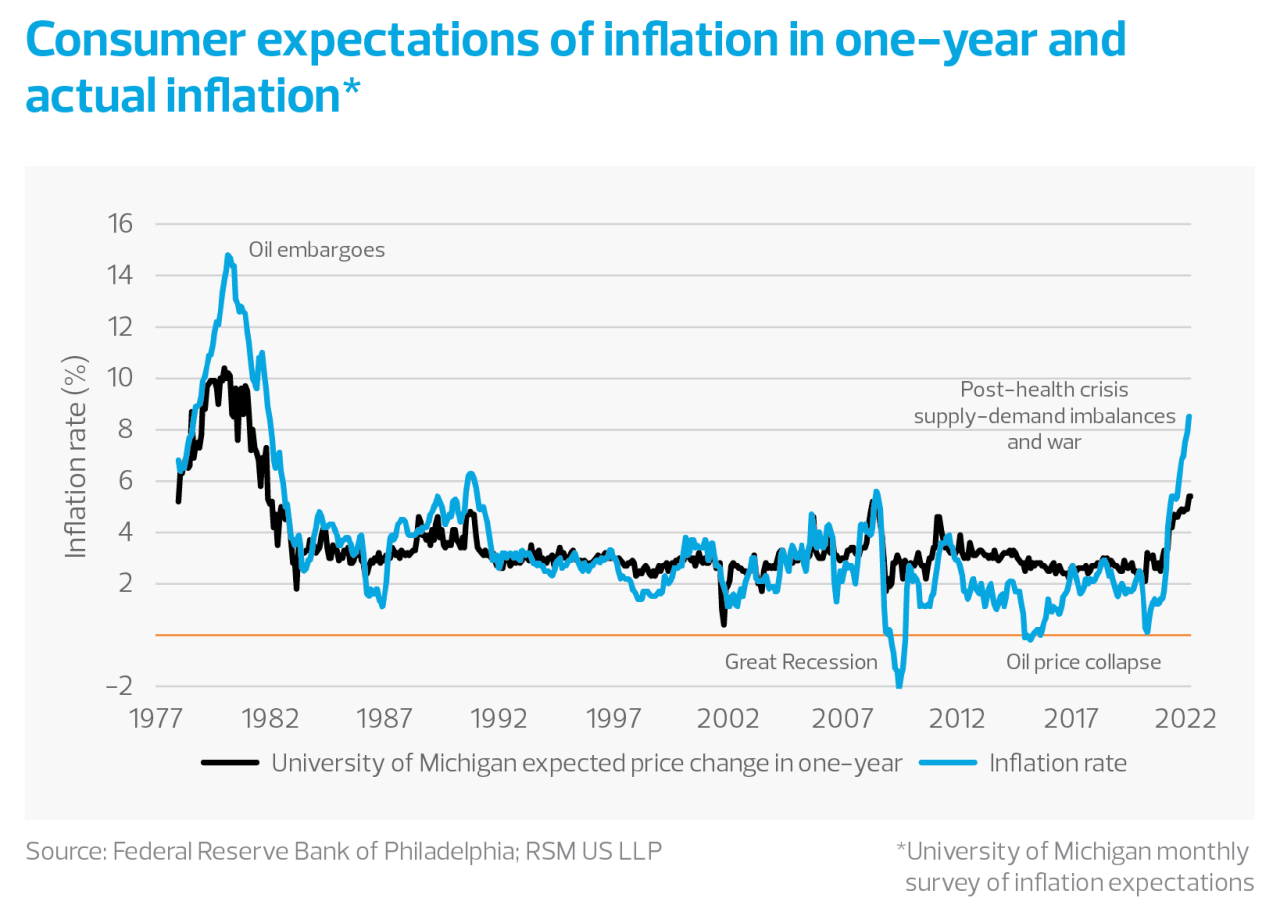
Even after the wartime oil price shocks sent the inflation rate above 7%, expectations remain subdued. As of April, inflation is expected to remain less than 3% over the next 12 months, reaching only 2.3% in 10 years. None of that is earth-shaking.

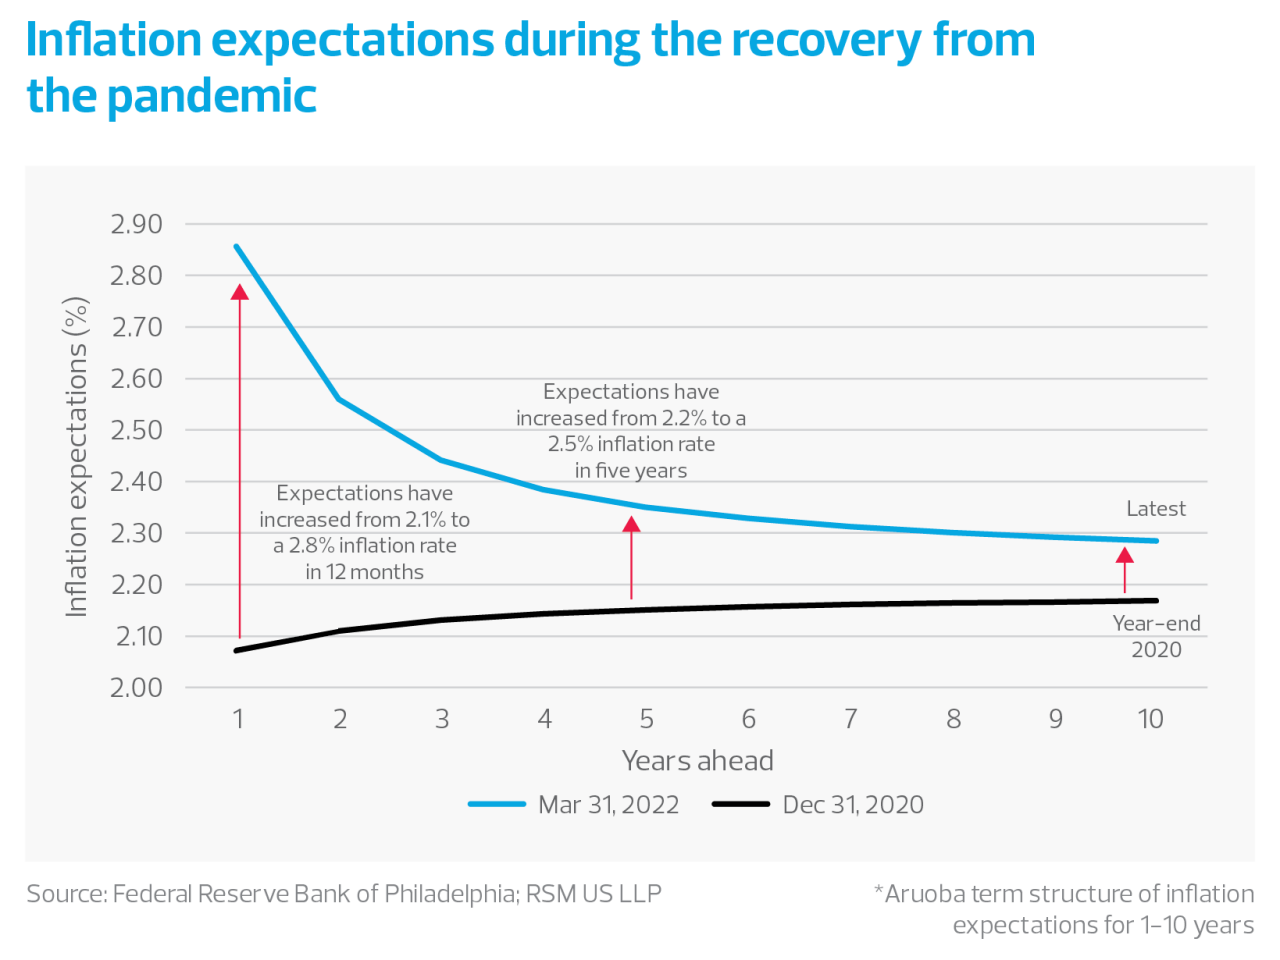
Inflation expectations during the recovery from the pandemic chart

And because of those low levels of inflation expectations, it seems unlikely that consumers would rush out to buy more goods for fear of rising prices. For one, those goods might not be readily available if China remains on coronavirus lockdown. Furthermore, April sentiment surveys suggest that consumer expectations have yet to absorb the full impact of prices rising at an 8.5% pace.

After all, consumer expectations are roughly based on prices at the pump and experience. That tends to lend itself to underestimating the full impact of price shocks, from oil shortages (the 1970s), severe economic downturns (2008-09), oil price collapses (2014-15), and, most recently, to the fuel and product shortages of the post-pandemic era.

Additional product shortages seem particularly acute if China’s vaccines remain ineffective. That would imply the potential for more coronavirus variants, more infections and more shutdowns in the months, if not the years, to come.

With the exception of housing, consumers have the flexibility to choose among products or to delay purchases. Consumers do not have a choice when it comes to food or energy.

Now consumers will have to factor in the war and any additional geopolitical shocks. That will involve accounting for disruptions in the supply of petroleum products that affect a host of products, ranging from cheaply made goods shipped to North America to the fertilizers and diesel used in a global agricultural sector.

Customer expectations of inflation in one-year and actual inflation chart

The impact on energy and food

The Fed has the difficult task of adapting to fast-moving circumstances after a period of worrying about deflation, insufficient investment in domestic productivity and the inefficient distribution of wealth.

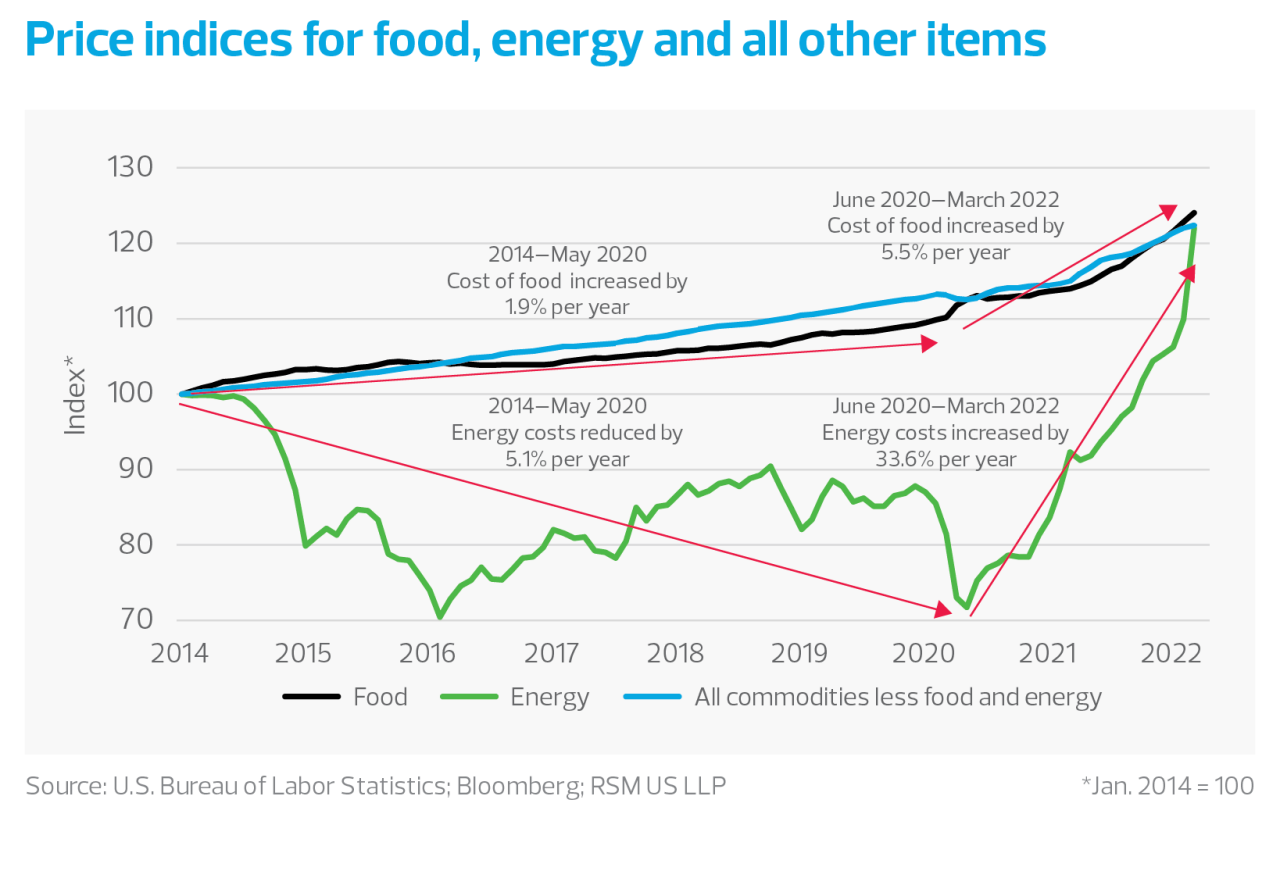
Costs for all items, excluding food and energy, were rising by only 1.9% per year from 2014 through the early months of the pandemic, a sign of a stagnant economy.
But since June 2020, those nonfood and nonenergy goods and services have been increasing at a 4.7% average annual pace, with much of that acceleration coming after the introduction of the vaccines and because of the rising costs of a housing shortage.

Consumers have little consequence that energy costs dropped by 5.1% per year from 2014 to May 2020. Since then, energy price increases have become a fixture, rising at an average rate of 33.6% per year. To make things worse, energy prices increased by nearly 16% in the first few months of the year, with crude oil prices increasing by nearly 40%.

Food price increases from 2014 to 2020 were subdued, growing at a 1.9% annual pace, which was roughly in line with the general trend with core CPI, which excludes food and energy. Since June 2020, the food prices have increased at a 5.5% annual pace, with the breadbaskets of Europe under siege in Ukraine or cut off from markets in the West by sanctions.

Price indices for food, energy and all other items chart

Energy shortages and higher prices

There is little reason to believe that energy prices will moderate any time soon.

Russian oil supplies are coming off the market in Europe. Although the demand for natural gas will diminish over the summer, it will most likely take more than the summer for Europe to complete its crash course in ending its dependence on Russian petroleum products.

And Russian oil companies have been required to increase their percentage of domestic gasoline and diesel product sales. At the margin, at least, this implies further disruptions to the global energy market and continued high prices.

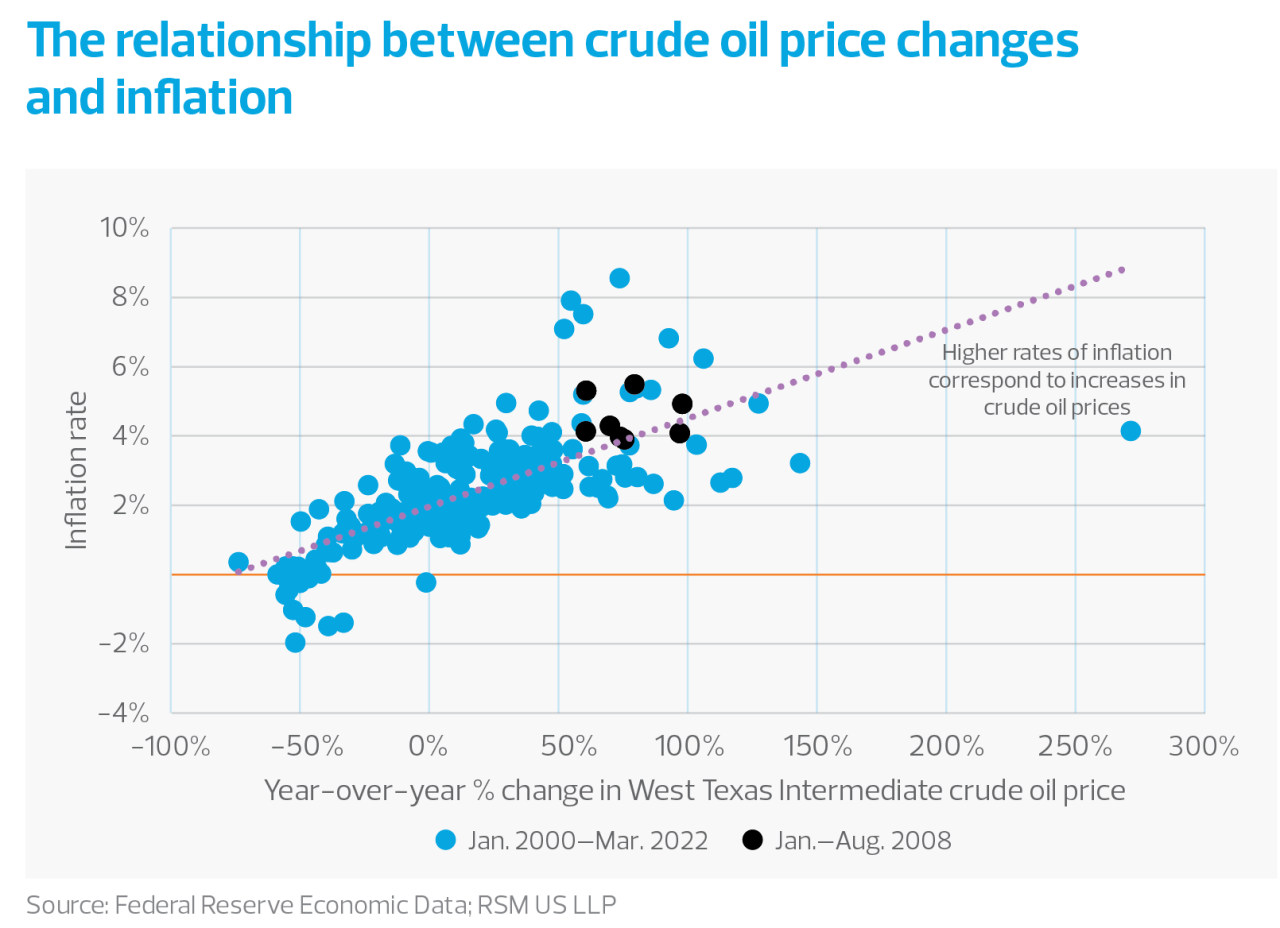
As we have noted, higher inflation rates accompanied rising energy prices from 2000 through March 2022. Extraordinary inflation rates occurred because of base-period effects relative to the sharp drop in demand during the pandemic and in the first months of 2008 when oil prices spiked higher.

The relationship between crude oil price changes and inflation chart

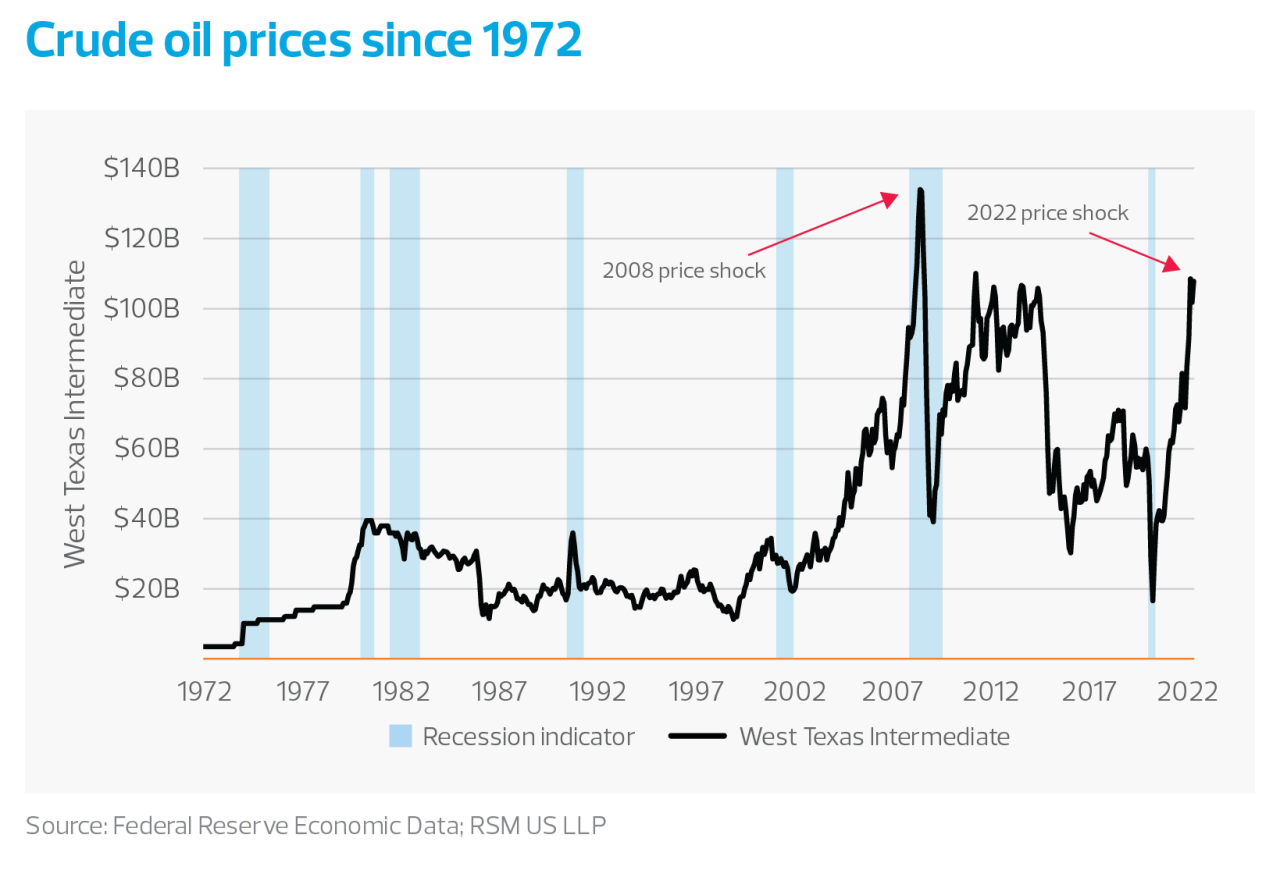
Interestingly, the current period seems most similar to 2008, when production issues and turmoil in the Middle East led to shortages and oil prices exceeded $130 per barrel.

Unless there is a diplomatic breakthrough, the war in Ukraine is likely to grind into a stalemate, with the West no longer willing to fund Russia’s military spending through energy purchases.

Crude oil at $108 a barrel is about 20% below the 2008 peak of the West Texas Intermediate benchmark. But a direct comparison and forecast of where all this will end are difficult to make.

The shale revolution in North America has increased supply over the past decade. And the move toward nonfossil fuel generation and the greater efficiency of vehicles all need to be considered.

In addition, a quarter of the World Trade Organization, including India and China, has not signed on to the boycott of Russian trade.

It seems unlikely for OPEC to significantly increase its production if the major players value the efficacy of OPEC+ and with production among the lesser players approaching limits. The likelihood of a price crash or correction seems less likely in the near term.

Crude oil prices since 1972 chart

Food shortages and higher prices

The World Trade Organization finds that “the most immediate economic impact of the crisis has been a sharp rise in commodity prices. Despite their small shares in world trade and output, Russia and Ukraine are key suppliers of essential goods, including food, energy and fertilizers, supplies of which are now threatened by the war. Grain shipments through Black Sea ports have already been halted, with potentially dire consequences for food security in poor countries.”

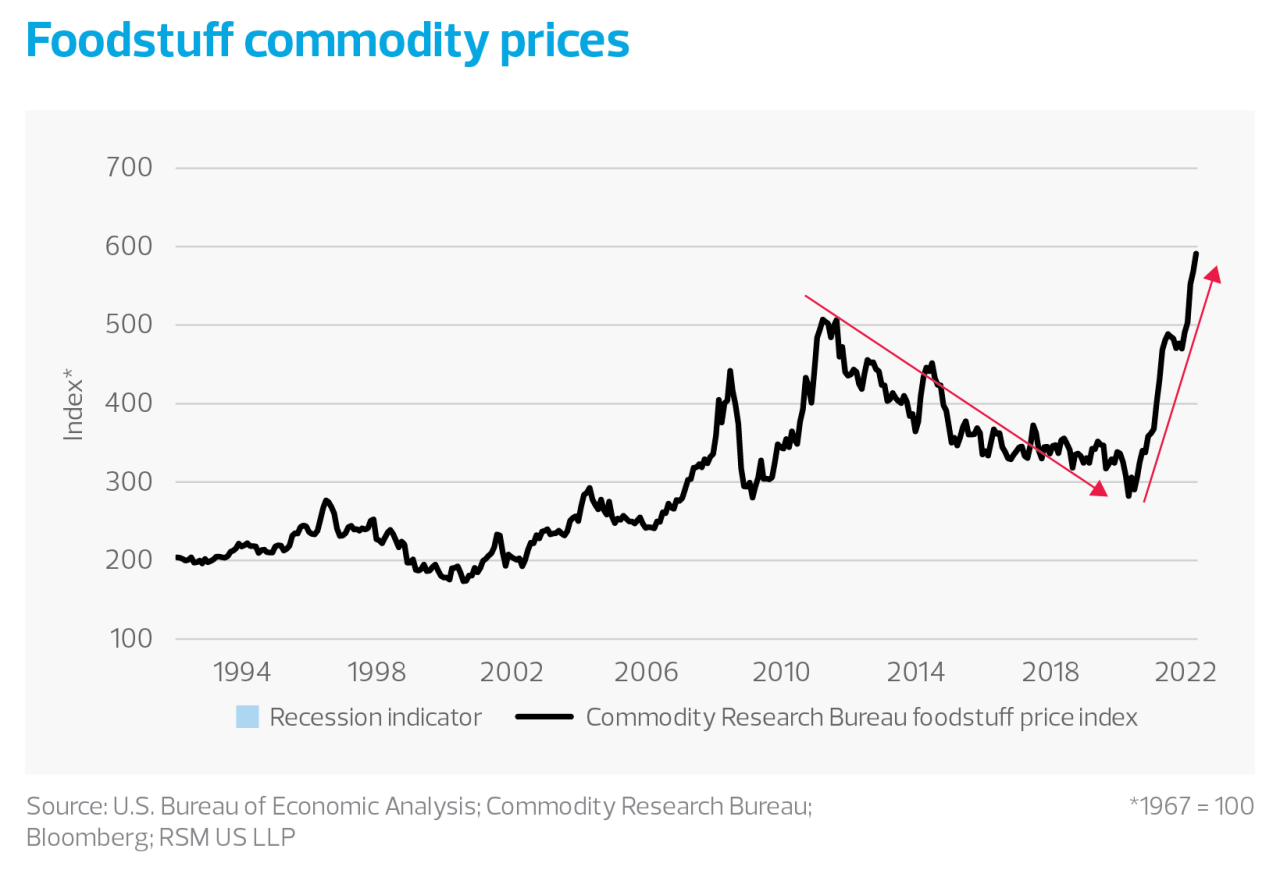
This distressing assessment comes on the heels of what looked to be a cooling of foodstuff costs at the end of last year. Because of Russia’s invasion, the price of foodstuffs resumed its 43% average annual growth rate that began during the economic shutdown in early 2020.

While Russia’s agricultural sector will most likely suffer from trade restrictions with the West, Ukraine’s infrastructure is being destroyed, eliminating Russia’s competition in Eastern Europe.

Foodstuff commodity prices chart

According to The New York Times, Russia is the largest exporter of fertilizer, with producers in South America scrambling for alternative suppliers.

And Russia and Ukraine account for 30% of wheat exports, which will not be easily replaced. According to the United Nations, inventories are already tight in the United States and Canada, Argentina is limiting exports, and Australia is already at full shipping capacity.

Finally, in addition to the burden on households dealing with rising prices, food shortages become a national security problem for everyone. As the World Trade Organization highlighted, should disruptions in the supply chain for commodities continue, history has shown that we can expect social unrest in countries that rely solely on food imports.

RSM contributors

More from The Real Economy

The Real Economy

Monthly economic report

A monthly economic report for middle market business leaders.

Industry outlooks

Industry-specific quarterly insights for the middle market.