The Real Economy

The difference between noise and signal in U.S. wage growth

#
The Real Economy

The pandemic and the economic shutdown it prompted have injected an inordinate amount of noise into the economic data, making policy judgments, which are always difficult, far more challenging.

With those challenges, the risk of large errors that carry significant ramifications for the economy is embedded into the discussion around the risks linked to inflation.

So what are those risks? If policymakers exit too early from accommodative positions, they would almost certainly face another decade of disappointing economic and wage growth. But if they overplay their hands and continue the accommodative policies for too long, they risk overstimulating the economy and spurring unwanted inflation.

At the center of this discussion is wage growth. While we are observing some indicators that imply modest wage growth, at this point, it is more noise than signal and does not imply an imminent breakout in wage push inflation that would end the three-decade period of quiescence in pricing.

While we are observing some indicators that imply modest wage growth, at this point, it is more noise than signal and does not imply an imminent breakout in wage push inflation that would end the three-decade period of quiescence in pricing.

Cause for concern?

Government support for employers and direct subsidies through unemployment insurance have managed to maintain an income stream for low-wage workers. Spending among low-income households is up 22.6% compared to January 2020 largely because of those direct transfer programs, and it has put a floor under the economy during the pandemic. Furthermore, direct payments for child support beginning in July will help more parents afford child care and allow them to return to work.

MIDDLE MARKET INSIGHT: Direct payments for child support beginning in July will help more parents afford child care and allow them to return to work.

These payments, along with accommodative monetary policies, have stimulated a discussion around whether too much money is flowing into the economy and if that poses a risk of inflation.

Given the increase in the M2 money supply from $15.4 trillion to $19.8 trillion during the pandemic, in addition to the $5.7 trillion in fiscal aid over the past year, this concern is understandable.

Transmission mechanism and expectations

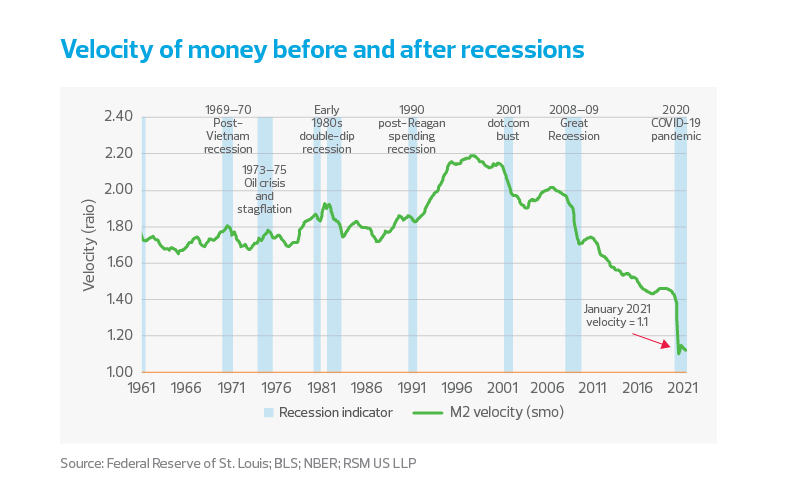
But there needs to be a transmission mechanism to cause that inflation. If one expects an increase in inflation, then one should expect an increase in the velocity of money—or the rate at which money changes hands—and a change in inflation expectations. A look at that is quite illuminating.

Velocity of money before and after recessions
chart - wages - TRE 06/21 - chart 1

The velocity of money has barely budged. After a modest increase in early 2020, it then moved down to close the year. Put simply, there has not been a statistically significant relationship between economic growth and the supply of money for decades.

Growth in the M2 money supply increased from $3.7 trillion in 1996 to $15.4 trillion in January 2020, a period when broad disinflation characterized the U.S. economy. During the past decade, when inflation averaged 1.5%, the growth in the M2 money supply increased from $8.4 trillion to $15.3 trillion.

Inflation expectations imply price stability
chart - wages - TRE 06/21 - chart 2

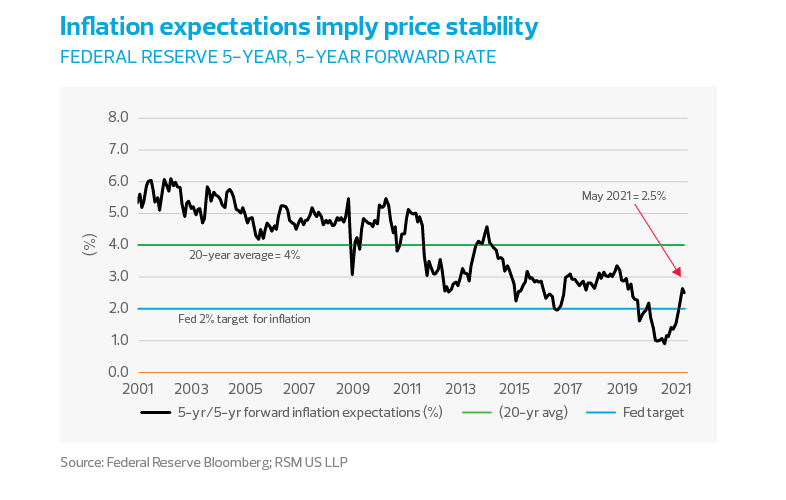
In addition, a look at inflation expectations—our preferred metric, the Federal Reserve’s five-year, five-year forward inflation expectation rate, stands at 2.5%—shows that they remain well anchored and imply price stability, not inflation, hyperinflation or dollar debasement.

Noise and signal

Given the broad and deep disruption to the economy during the pandemic, it can be difficult to discern noise from signal in the data.

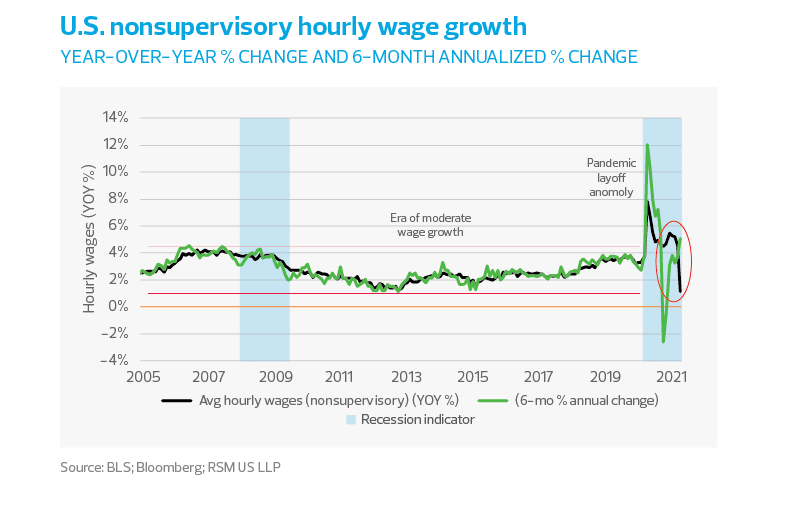
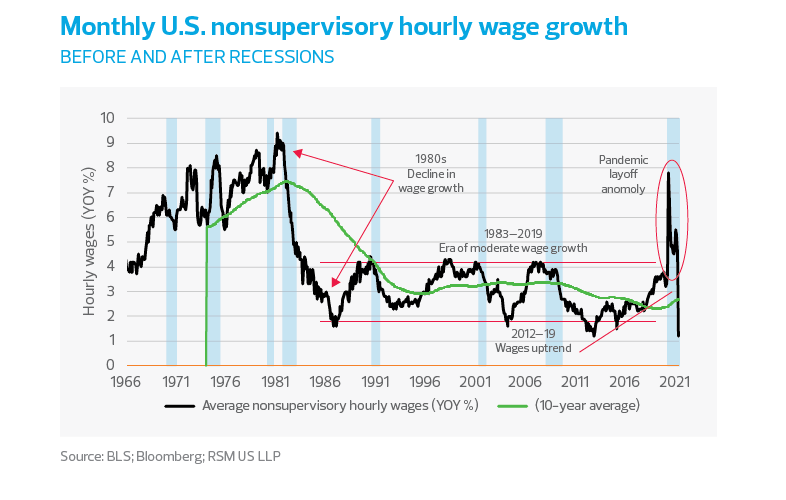
For example, going into the pandemic, the 10-year average of hourly wage growth for nonsupervisory employees was less than 2.4% per year, not much considering that ordinary levels of inflation would negate most of those gains. That is a pure signal.

But after wages rose at an abnormally high rate during the pandemic—mainly because higher-paid workers were retained and lower-paid workers were let go—hourly wages in March grew by 4.2% on a year-ago basis.

Then as 311,000 low-paid workers in leisure and hospitality returned to the labor force, that year-ago metric slowed to 0.3%. We would categorize this as noise.

US nonsupervisory hourly wage growth
chart - wages - TRE 06/21 - chart 3

That being said, wage growth for nonsupervisory employees advanced 5.1% on a six-month average annualized pace inside the April jobs report. This captures the early portion of the recovery and the competition for workers returning to the labor force as the recovery accelerates.

That dynamic, along with the increase in economic activity, has raised concerns of an overheating economy and price increases because of labor market tightness and wage pressure.

But with a headline unemployment rate of 6.1% and a 10.4% underemployment rate, the 8.2 million people still out of work are unlikely to form the impetus for what was once referred to as wage-push inflation.

This is more likely to reflect temporary and transitory noise for what will be a unique recovery and expansion following the exigent circumstances of the pandemic.

With a headline unemployment rate of 6.1% and a 10.4% underemployment rate, the 8.2 million people still out of work are unlikely to form the impetus for what was once reffered to as wage-push inflation.

In addition, we would urge caution in drawing conclusions on past recoveries and expansions compared to the unique context of the post-pandemic economy. Focusing too much on what we think constitutes noise will lead to a premature curtailment of the current recovery that would dampen growth and employment conditions.

Monthly US nonsupervisory hourly wage growth
chart - wages - TRE 06/21 - chart 4

Nevertheless, policymakers are bound to point toward wage growth in the first quarter of the year, which remained at 5%, well above its trend during the 2010-19 recovery from the Great Recession.

Though the employment cost index (salaries plus benefits) leveled off at 3% per year in 2018-19 before dropping off during the pandemic, the upward trend in the marginal cost of labor will likewise draw attention, spurring calls for the central bank and the fiscal authority to pull back on their accommodative policies.


Wage and benefit components of the US employment cost index for all civilian workers since 2010
chart - wages - TRE 06/21 - chart 5

RSM contributors

The Real Economy

Monthly economic report

A monthly economic report for middle market business leaders.

Industry outlooks

Industry-specific quarterly insights for the middle market.