As the economy picks up steam, concerns about a debt hangover like the one that followed the 2008 - 2009 financial crisis are proliferating.
But with American household balance sheets the strongest in decades, we see little chance of a consumer debt hangover interrupting the current expansion anytime soon.
Focusing on the ratio of debt to household wealth - as opposed to the far less useful debt-to-GDP ratio - elicits a constructive and encouraging outlook.
A close look at both household and national balance sheets indicates that this concern is somewhat overblown and misses the growth in household wealth—however inequitably distributed—over the past few decades and its ability to finance public debt and infrastructure improvement.
Focusing on the ratio of debt to household wealth—as opposed to the far less useful debt-to-GDP ratio—elicits a different, constructive and encouraging outlook.
In addition, it implies that the American economy has far more fiscal space than has traditionally been acknowledged, which contributes to the conversation on addressing long-neglected infrastructure and social needs.
Household wealth and debt
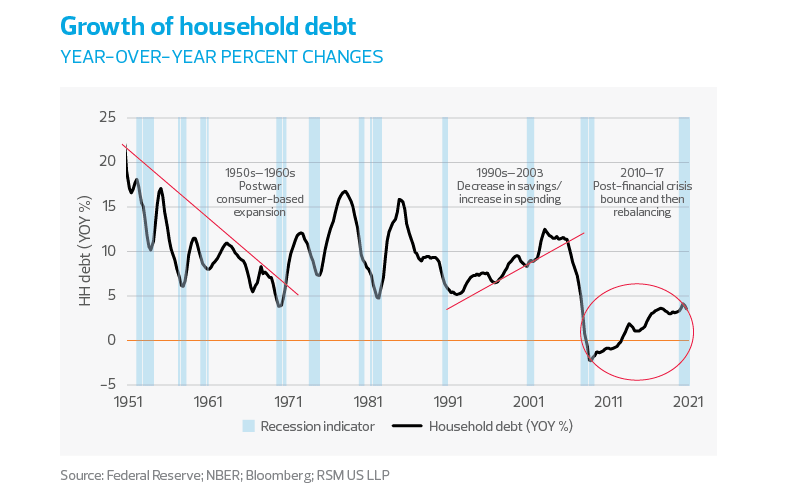
Consumer credit as a percentage of gross domestic product, which is the customary way to look at household debt, has been in decline since the 2008–2009 financial crisis.
During the sluggish decade-long recovery from that crisis, households were coping with housing market losses, job losses and the decelerating growth of real personal income as the economy finished its transition from high-wage manufacturing to lower-paying service-sector employment.
The result was household deleveraging, with consumer debt as a percentage of nominal gross domestic product falling from 98% in 2008 to 74% in the months before the pandemic.
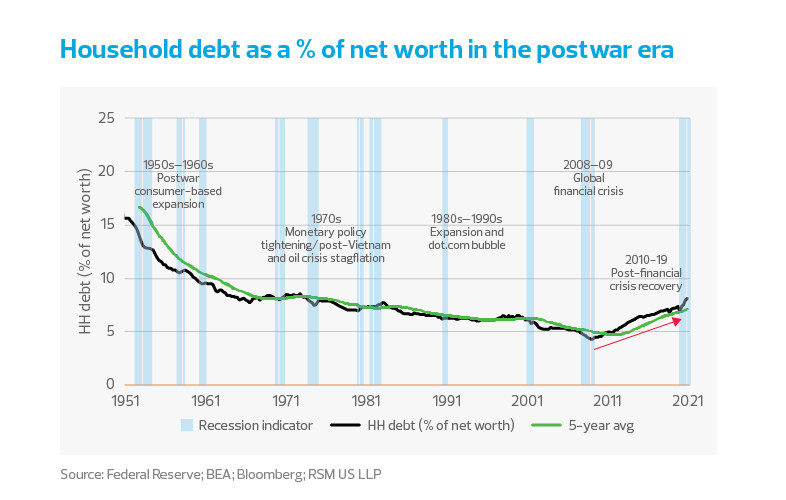
But perhaps a better way to view the accumulation of household debt is to measure it relative to household wealth. The ratio of debt to net worth is a measure of the ability of households to support the debt they have taken on.
As our analysis shows, household debt as a percentage of household net worth has moderated across the postwar decades as wealth accumulation became accessible to the middle class through higher wages, government mortgage programs and tax benefits. Household debt as a percentage of net worth declined from 19.4% in the 1950s to 4.3% in 2009.
Since the financial crisis
In the decade since the 2008–2009 financial crisis, the four-quarter average of the ratio of household debt to net worth increased to 7.75% in the first quarter of 2021, which by itself might cause some consternation.
But in the context of increased costs of education and housing—both of which are investments in household capital—a ratio of debt to net worth of less than 8% is still well below historical levels of debt.
But it is also important to note that the peculiar demographics of the United States require an increase in medical care and allocation of capital to support the retirement of the baby boomers, which will need to be financed by that increase in overall national wealth.
MIDDLE MARKET INSIGHT: In the context of increased costs of education and housing, a ratio of debt to net worth of less than 8% is still well below historical levels of debt.
In addition, household debt has increased by 24% in nominal terms compared to the second quarter of 2012, when household debt resumed its growth after the Great Recession.
But during the same period, household net worth has increased by a total of 78%. Even taking into account distributional concerns, this implies that both the household and national financial positions are far better off than generally understood—and suggests that households today are able to support current levels of debt.
In the sections that follow, we look in more detail at household debt and accumulation of wealth.


