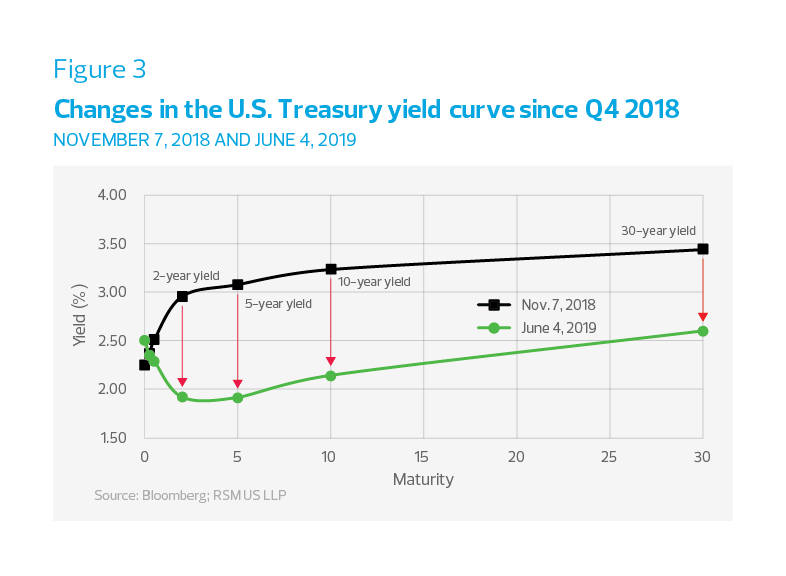
However, as with all human endeavors, that doesn’t necessarily mean that the end is near. As we noted in an earlier report, a yield curve inversion suggests a climate conducive for slipping into a recession, rather than predicting a recession in coming months. Within that climate, though, recessions are sparked by an event, and we seem to be going from one economic or geopolitical spark to another of late.
Must all good things come to an end?
The economic recovery that began during the June 2009 trough of the Great Recession is now on the eve of its 10th anniversary. Should the National Bureau of Economic Research, the final arbiter of business cycle peaks and troughs, decide that the economy is still growing through the second quarter, the current recovery will have outlasted the Dot.com Boom of 1991-2001.
What are economic indicators suggesting?
The NBER looks at various indicators and indices (including yield-curve models and monthly GDP estimates) to determine when the business cycle stopped growing and when the downturn began. The NBER’s assessment is complex even after the fact, but the financial markets are operating in real time, or as close as possible to the release of indicators that are collected and reported in the weeks or months after the economic activity has occurred.
The following is a sample of monthly economic indicators that are listed as inputs to the NBER decision process and are conventionally followed by the bond market. In each case, the indicator shows a drop-off in economic activity since the third quarter of 2018, confirmation of what the bond market has been anticipating.
Industrial production – while real GDP grew by 3.2% in the first quarter of 2019, the downturn in industrial production is now seven months long. Industrial production in September 2018 was 5.4%; in April 2019, industrial production growth slipped to 0.9% before correcting to 2% growth in May, all on a year-over-year basis.
Manufacturing and trade sales – economic activity included in manufacturing shipments and retail and wholesale trade sales peaked at 8.4% in May 2018 and remained strong throughout the summer. Since then, sales growth slumped to 2.1% in December before popping back up to around 3% in March and April 2019 on unexpectedly strong retail activity, all on a year-over-year basis.
Real disposable income – as the economy strengthened and employment opportunities and wages finally began to grow on what looked to be a sustained basis, households experienced an increase in real disposable income from the summer of 2016 through the end of 2018, peaking at a 3.9% growth rate. Since then, real disposable income slipped again to nearly a 2% growth rate in March and April 2019, all on a year-over-year basis.
Total hours worked – the labor market generally lags the business cycle; it can take a while before employers are willing to add staff at the start of an upswing, and it can also take a while, because of contractual or personal obligations, to cut back on staff when an economic recovery reaches maturity. This could be the current situation. The upward trend in total hours worked appears to have peaked at a 2.5% growth rate in May 2018 and then cooled down to 1.5% growth by May 2019, all on a year-over-year basis.
Employment growth – as with other labor statistics, you would expect employment growth to lag behind the trends in the business cycle—slow to increase as the recovery first gains momentum, and then slow to decrease as the recovery winds down.
Employment growth was moving higher from Q3 2016 through the last quarter of 2018 when it hit a 2% pace. That pace has not been sustained in 2019, however, slowing to a 1% rate in April, all on a year-over-year basis.


