The Real Economy

Policy cliffs approaching as economy slows

August 03, 2020
#
Economics The Real Economy

While we anticipate that Congress will approve a fifth round of fiscal aid to support the economy as the pandemic intensifies, it is now clear that this aid will not be put in place in time to prevent an air pocket in the economy later this summer.

The lapse in aid to 20 million Americans that pumped roughly $116 billion into the economy in June alone will result in a slower rebound in overall economic activity during the current quarter. That puts at risk our forecast of a 14.2% increase in U.S. gross domestic product in the third quarter.

Through the first week of July, households at the bottom of the income ladder—the three lower-income quintiles— have reduced their spending by only 1.9% compared to the 10.8% reduction among upper-income households and 6.8% overall.

This goes directly to the heart of why fiscal aid was targeted at the unemployed—40% of households making under $40,000 per year have experienced job and income losses—rather than to the employed through tax cuts. It shows just how critical that aid is to supporting the economy. Absent a sufficient round of aid, investors should anticipate a significant slowing in household spending and another round of permanent job losses.

The last thing the economy, which began to level off in late June as the pandemic began to cause pullbacks, needs is a policy-induced downturn leading to rising unemployment and a slower pace of consumer spending.

MIDDLE MARKET INSIGHT Although we think the worst of the economic shock is in the rearview mirror, this economy is not yet out of recession and could very well remain in negative terrain if there is not sufficient policy support.

While bills for subsequent relief legislation move through Congress, the additional $600 per week aid to the unemployed under the Federal Pandemic Unemployment Compensation expired on July 25, just one day after the end of the federal moratorium on evictions, which puts at risk roughly 22 million people.

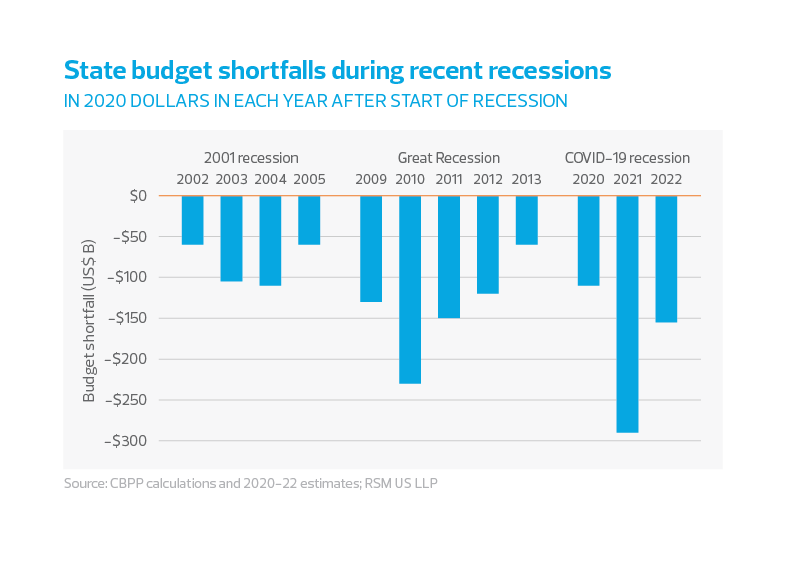
State budget shortfalls during recent recessions
chart - policy - TRE 08/20 - chart 1

At best, we think that there will be no legislation on this until mid-August, with a substantial delay in actual payments showing up in pocketbooks.

We cannot overemphasize just how important the next several weeks are for the domestic economic outlook. Beyond the expiration of the eviction moratorium, foreclosure moratorium and unemployment assistance, Aug. 8 represents the final day to apply for Paycheck Protection Program loans despite $132 billion remaining on the books.

Moreover, the hole that has been blown in the balance sheets of state and local governments because of declining tax revenues will require direct aid from the federal government. The Center on Budget and Policy Priorities estimates that there will be a $110 billion shortfall in state and local budgets this year, $290 billion next year and $135 billion in 2022. One way to ensure a disappointing recovery or to cause a double-dip recession is to not address this critical issue.

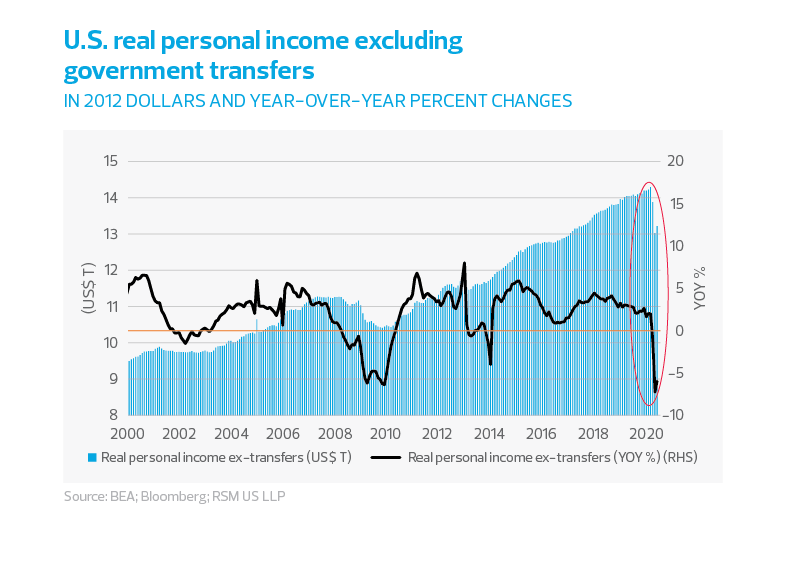
U.S. real personal income excluding government transfers
chart - policy - TRE 08/20 - chart 2

It is important to note that Congress and the administration acted decisively by unleashing about $1.2 trillion into the economy between April and June. But those programs are set to expire, dropping by $1 trillion over the course of the next six weeks, as reported by The Washington Post.

So once again, a confluence of events—the expiration of programs designed to maintain income and consumer spending during the pandemic—could have disastrous consequences for households and a significant impact on the depth of the recession and the length of time before the economic recovery begins.

Why prop up the economy?

Americans’ real personal income (excluding government transfers) began its decline in March at the start of the staggering loss of employment, and then fell by 7% in April and 6% in May as shown in the first figure below. Without government support, Americans are seeing a major contraction in their incomes at a time when the pandemic is already causing consumers to constrict their spending.

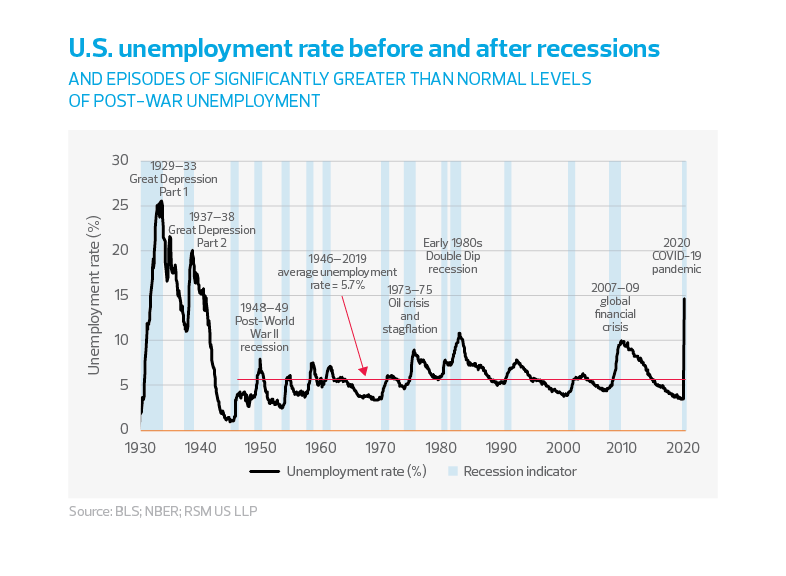
More than 52 million people have filed for unemployment insurance benefits over the past 18 weeks, with the unemployment rate jumping to unprecedented heights in the postwar industrial era.

The following figure shows how the economic shutdown during the pandemic caused the unemployment rate to approach 15% of the labor force before dropping to 11.1% in June as local economies began to reopen.

U.S. unemployment rate before and after recessions
chart - policy - TRE 08/20 - chart 3
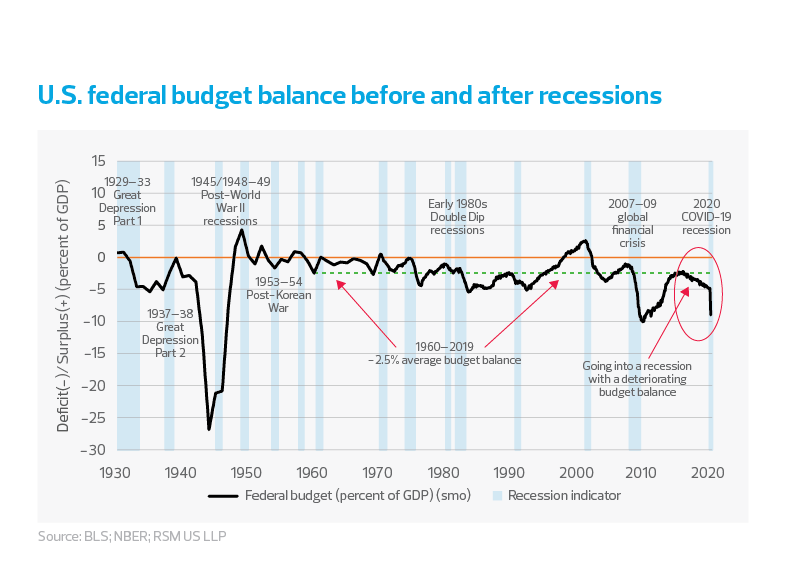
U.S. federal budget balance before and after recessions
chart - policy - TRE 08/20 - chart 4

But can we afford to prop up the economy?

The answer is yes, but that is probably the wrong question. The fact is that we the people are facing an existential threat not unlike the Spanish flu of 1918. The coronavirus pandemic has already claimed 650,000 lives worldwide and 150,000 in the United States, and that has happened in only six months. The right question, therefore, is can we afford to not prop it up?

As the figure shows and as we mentioned, the federal budget deficit typically improves during business cycle upswings (as tax revenues increase along with income levels) and then deteriorates during economic slowdowns (as workers are furloughed, social safety-net outlays increase and tax revenues decrease).

Since then, and because of the sudden increase in unemployed workers, the federal deficit has ballooned to 9% of GDP. But as the figure shows, that is nowhere close to the 27% deficits of the war effort in 1943.

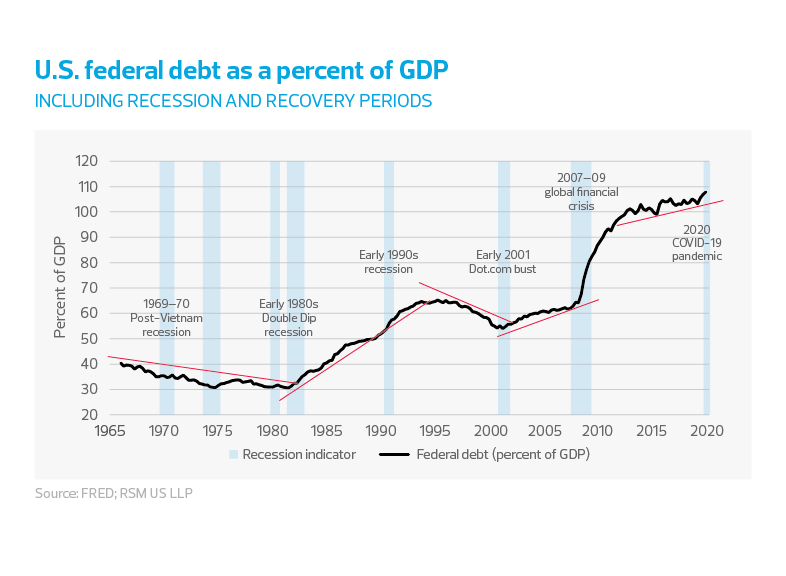
The next figure shows that the federal debt is now greater than 100% of GDP, a level once reserved for Japan and its lost decade of growth. Overlooked, however, is that debt relative to the level of GDP has been increasing since the 1980s, first when welfare reform and supply-side economics became the raison d’être for for tax cuts, bringing about reductions in funds necessary to operate the government.

And by the second decade of this century, management focus had shifted to maximizing stock valuation, which benefited from the offshoring of manufacturing, followed by the offshoring of corporate profits to tax havens to reduce U.S. tax liabilities.

At this point, there is no empirical evidence that rising deficits crowd out investment or will cause interest rate shock, debasement of the dollar or a decrease in the use of the greenback as the world’s primary reserve currency. We estimate that given the shape of the yield curve, the United States is well positioned to tap global debt markets to support the economy as it transitions through a pandemic that has yet to run its course.

U.S. federal debt as a percent of GDP
chart - policy - TRE 08/20 - chart 5

RSM contributors

The Real Economy

Monthly economic report

A monthly economic report for middle market business leaders.

Industry outlooks

Industry-specific quarterly insights for the middle market.