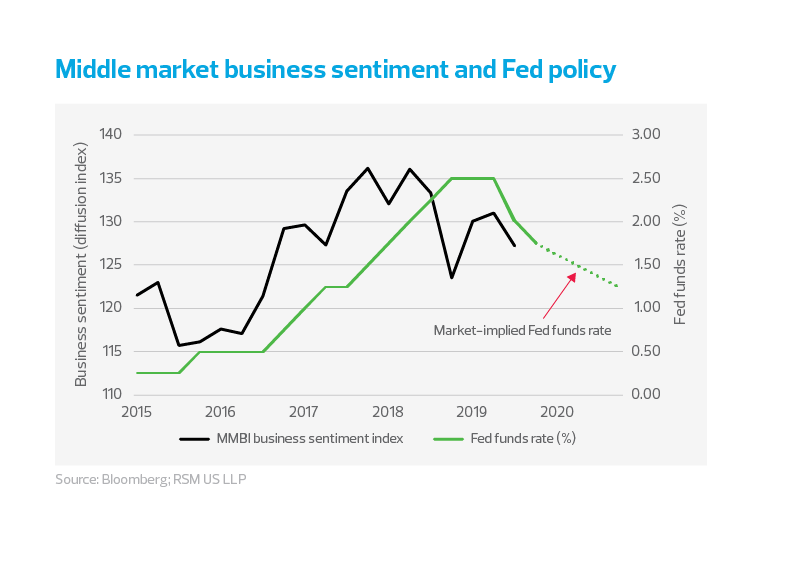
The decline in middle market business sentiment as measured by the RSM US Middle Market Business Index coincided with the mid-2018 imposition of tariffs. It then took six months for Federal Reserve policy to change course and partially offset U.S. trade policy by lowering interest rates.
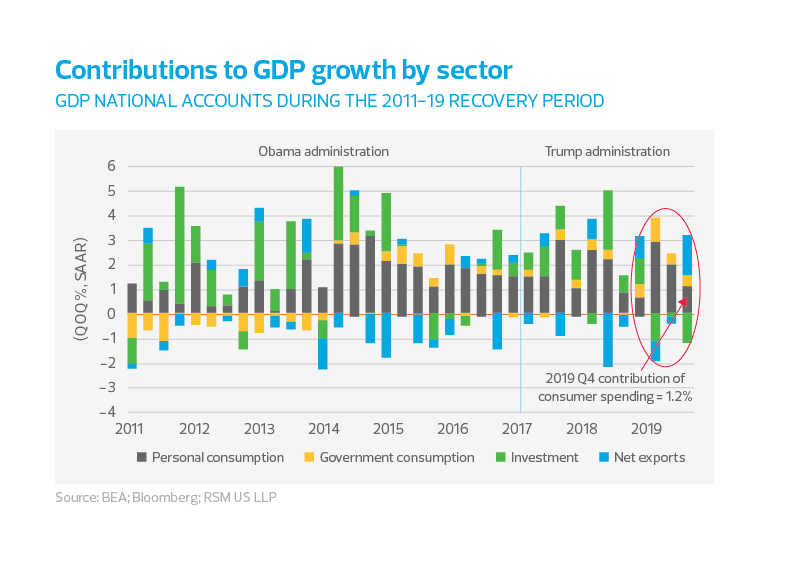
Fourth quarter growth buoyed by defense spending amid weaker data
The U.S. growth picture in the fourth quarter of 2019 was spot on trend, driven by strong government spending amid solid but slowing personal consumption. A large drop in imports, along with noticeable easing of spending, denotes some caution on the outlook in light of growing domestic and global risks.
Private investment fell by 6.1% on an annualized basis in the fourth quarter, and personal consumption—which has been the mainstay of the economy—grew by only 1.8%, with declines in both durable and non-durable purchases.
The economy enters 2020 on unsteady footing, linked to a far less attractive composition of growth, the shutdown of 737 Max production at Boeing and global headwinds that may pick up linked to the coronavirus crisis across the globe. As such, we expect the underlying economy to continue growing at its sub-2% rate.
This moderate growth outlook is clearly affecting global financial markets. The yield on the 10-year U.S. government security is trading near 1.57%, down 34 basis points since the beginning of the year. For now, this will not move the needle on Federal Reserve policy. We think the Fed will prefer to spend 2020 on the sidelines and out of the harsh political spotlight.
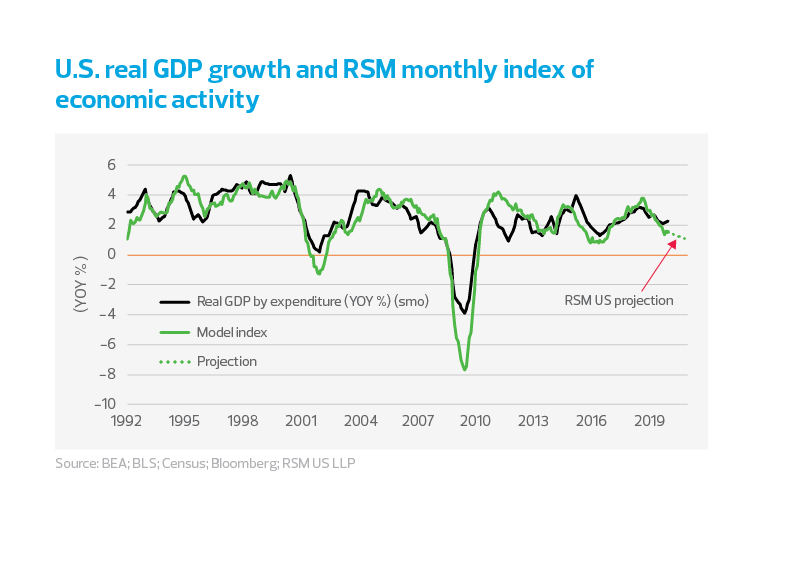
There are downside risks to our forecast if the downward revisions to nonfarm payrolls and the downward trend in the number of hours worked are not reversed.
Risk of permanent damage to U.S. manufacturing base
The 2017 Tax Cuts and Jobs Act provided a shot of adrenaline for upper-income consumer spending. Between personal (household) consumption and government spending, those sectors were able to maintain real GDP growth in the 2% range.
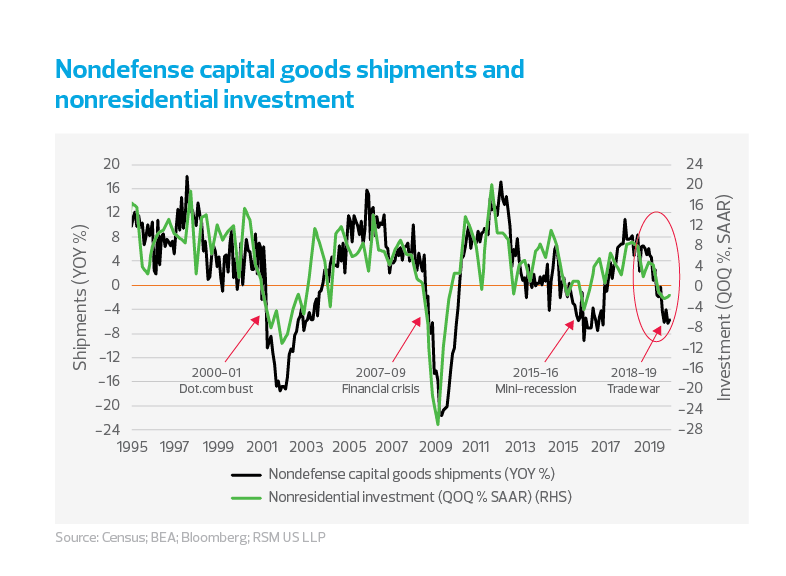
The impact of those tax cuts has yet to have a positive impact on business sector investment, however. Throughout this business cycle, the RSM US Middle Market Business Index has shown that middle market businesses have been slow to increase capital expenditures. This is concerning in light of today’s rapid pace of business transformation. The so-called industrial economies of the world are in a transformational stage, with manufacturing being off-shored to low-cost/lowwage centers in the developing economies, resulting in a worldwide decline in global growth and investment.
In the Q4 2019 MMBI survey, a plurality of middle market executives said their firms plan to increase outlays on capital expenditures or critical productivity-enhancing equipment, software and intellectual property. Only 46%, however, said they boosted capital expenditures in the current quarter and plan to do so during the next six months. Given the acceleration of the integration of technology into the production of goods and the provision of services in the broader economy, this reticence toward capital improvements will likely continue to remain a challenge throughout this business cycle and well into the next.
MIDDLE MARKET INSIGHT Midsize firms remain wary about making significant investments that would bring them in alignment or ahead of the technological curve; in our estimation, this remains one of the major risks to the middle market economy outlook going forward.
Meanwhile, U.S. shipments of nondefense capital goods are in decline as well, falling since the end of 2017, with the growth rate becoming negative since mid-2019 as trade disruptions continue from one trading partner to another. And as it has historically done, business investment has deteriorated in sync. Why invest when the market is shrinking?
Manufacturing orders remain weak
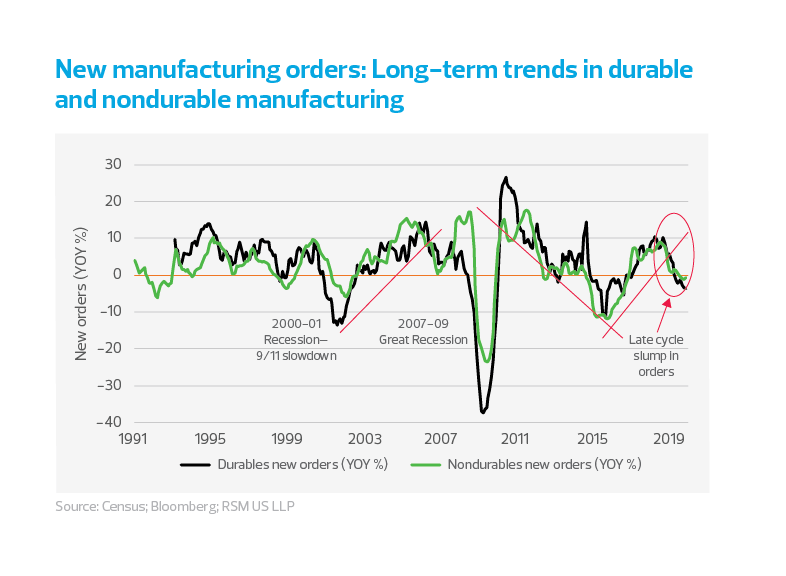
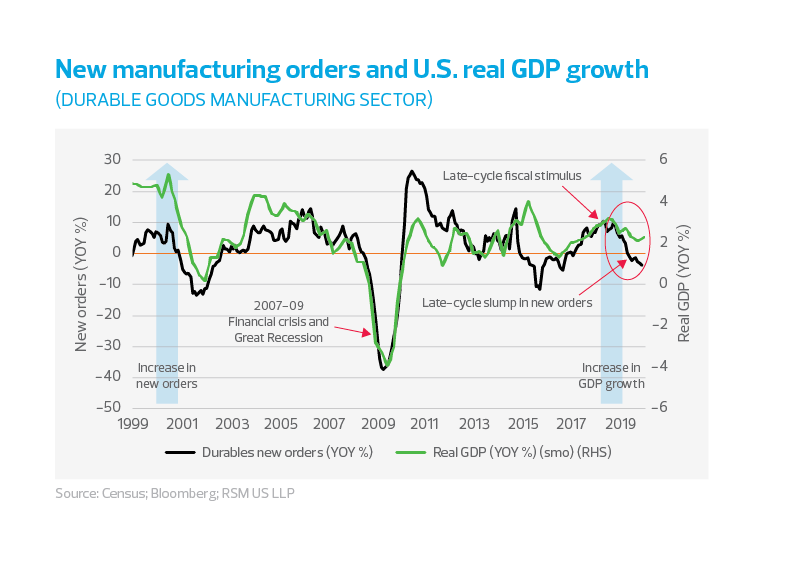
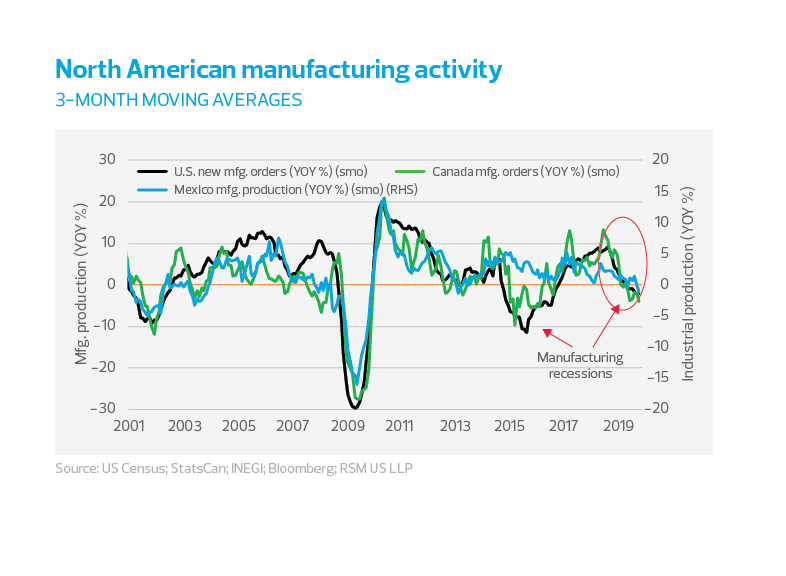
Manufacturing orders have been deteriorating since the imposition of trade tariffs took hold in the last months of 2018. The key long-term risk here is the potential for a permanent or long-term loss of markets for U.S. producers.
Inventory/Sales ratio
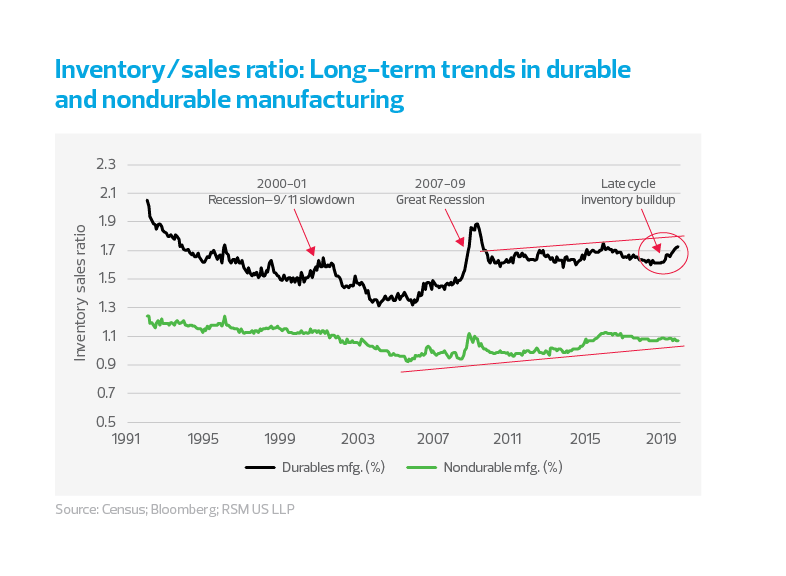
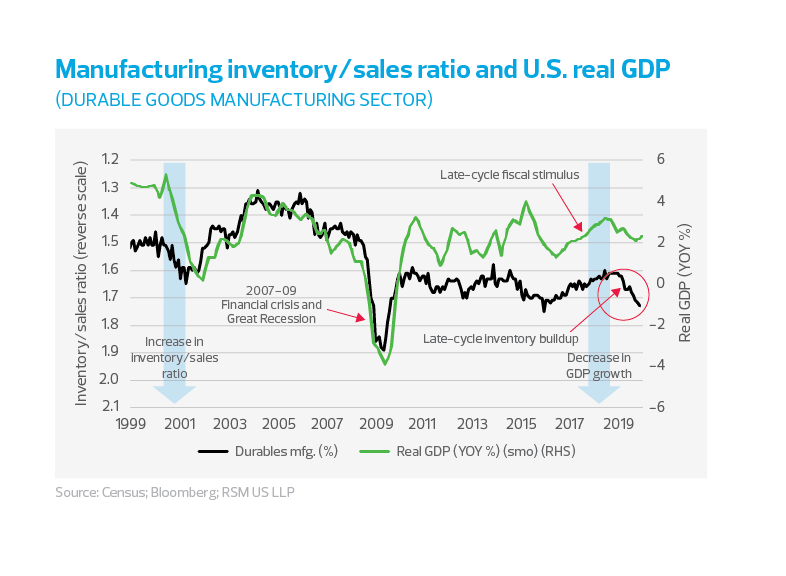
One would expect a buildup of inventories at the end of a business cycle, with producers likely to base production on the prior-period demand. The current cycle seems to confirm those assumptions, with inventories outpacing sales since November 2018, which might turn out to be the turning point for the business cycle.
Capacity utilization
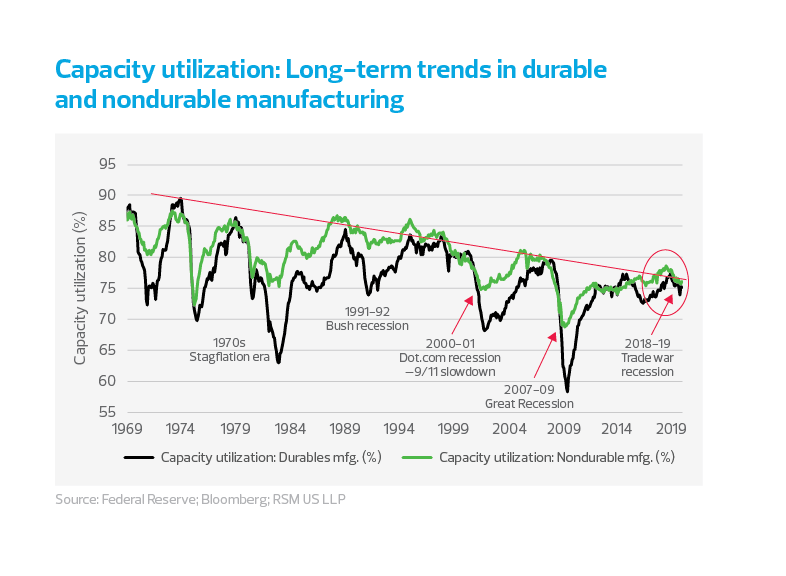
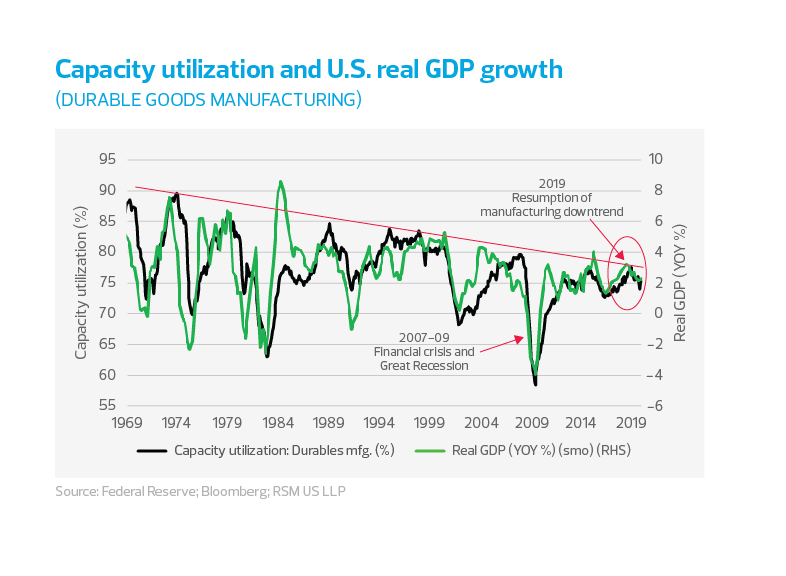
Excess capacity for manufacturers of durable (and now nondurable) goods since mid-2017 illustrates the damage caused by the trade wars and the global manufacturing recession. The losses from underused capacity are unlikely to be recovered.
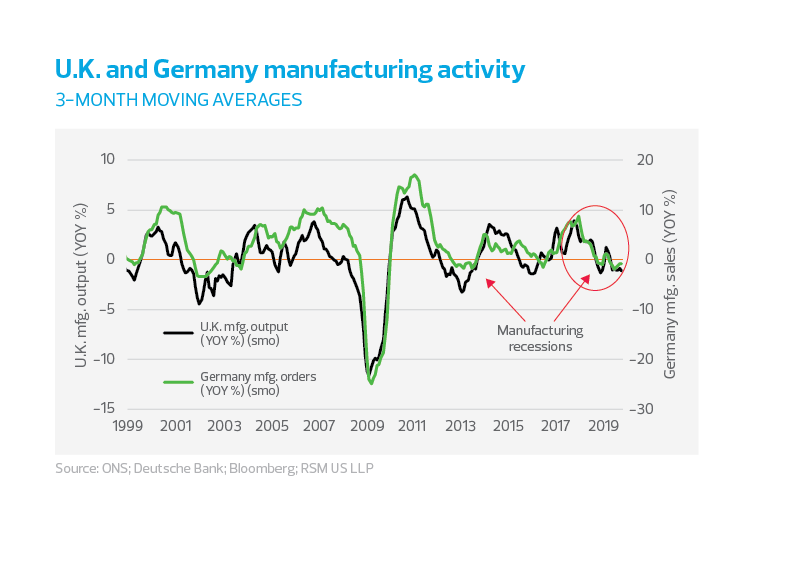
Global manufacturing may take years to recover from trade wars
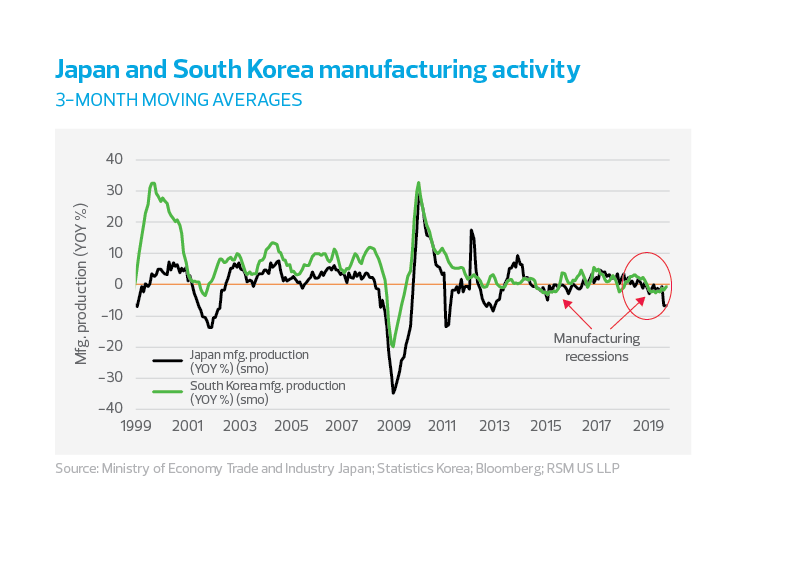
Manufacturing among the developed economies continues to struggle despite nascent signs that the worst might be behind us. But as an old economics professor of mine once stressed, an hour of lost labor can never be recovered. The damage of U.S. trade wars on China and then Germany might take a generation of growth to overcome, if ever. The same goes for the U.K. as it plots its split from the European common market.
ASIA/PACIFIC
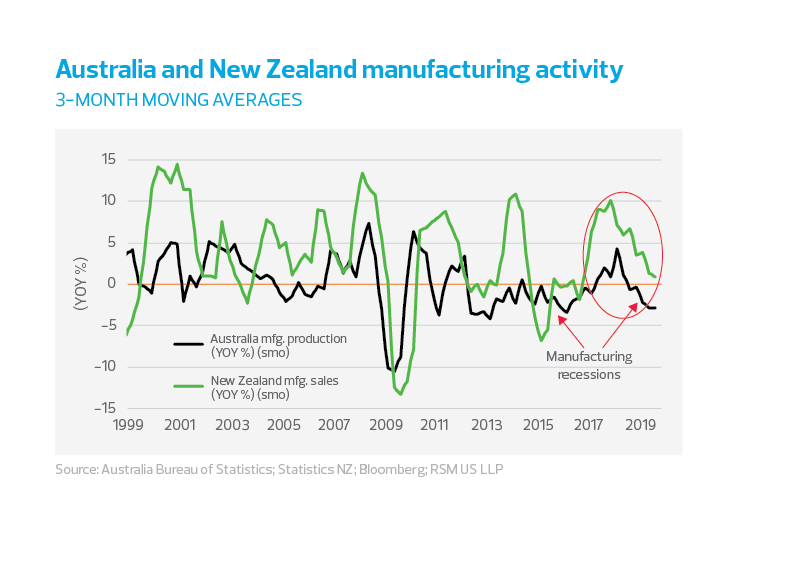
Japan’s manufacturing sector looks to be down and out, a victim of the loss of market share, demographic changes, decades of little or no growth, and now a global slowdown. Australia’s resource-based economy will be affected by the slowdown in global manufacturing demand, and now climate change.
BRICS
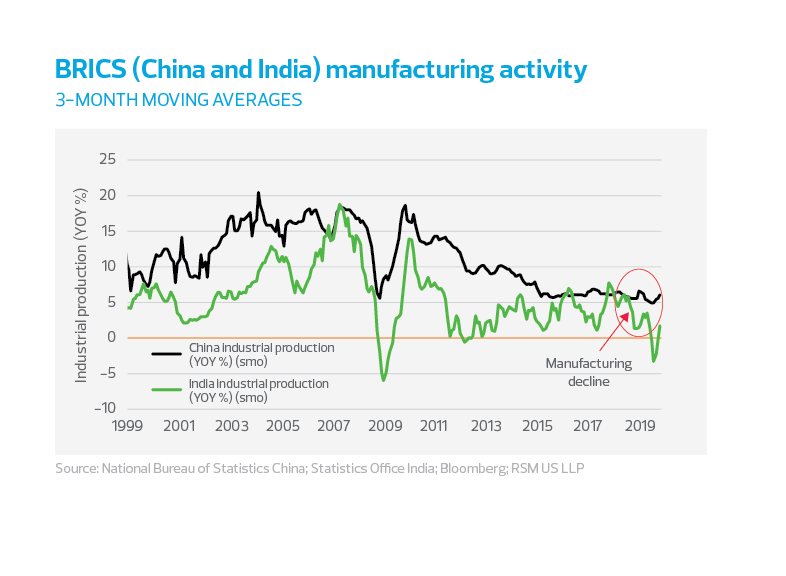
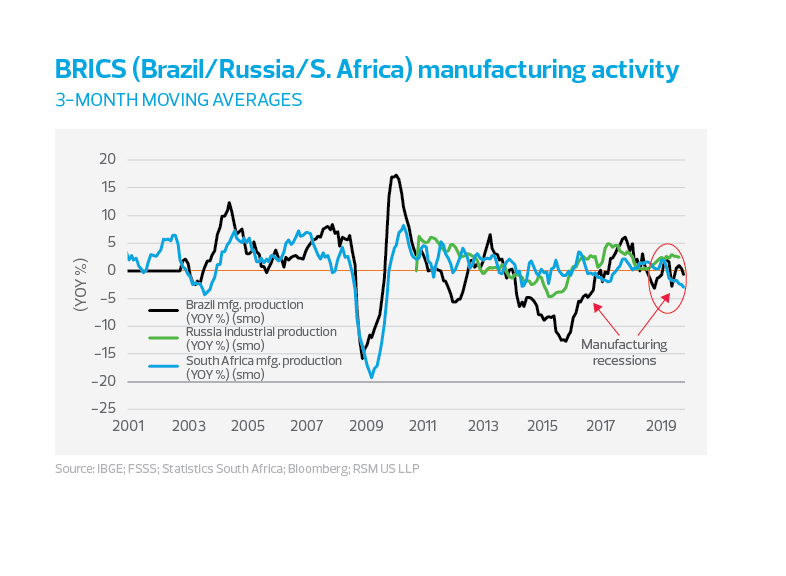
It seems likely that China will continue to offshore its manufacturing to the Asian tigers, shifting its focus on investment to economies that have yet to experience the wrath of U.S. trade policy. Brazil is an example of a beneficiary of U.S. policy as it becomes the world leader in the export of soy beans.
RSM contributors
The Real Economy
Monthly economic report
A monthly economic report for middle market business leaders.
Industry outlooks
Industry-specific quarterly insights for the middle market.


