A confluence of factors is conspiring to lay the groundwork for conditions increasingly threatening an end to the current business cycle. In this issue of The Real Economy, we present a number of easy-touse metrics and data visualizations for middle market businesses to formulate judgments around risks to the economic outlook. These include an array of financial, consumer and labor market indicators that, in some cases, can warn of a possible economic downturn.
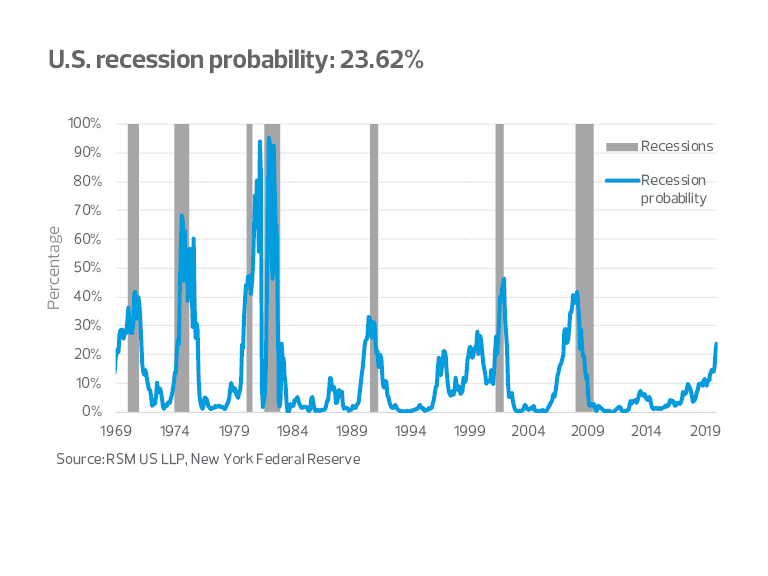
Our preferred recession probability model, the New York Federal Reserve’s Markov switching model, is currently forecasting a 23.62 percent chance of a recession occurring during the next 12 months.

Since 1960, once the Markov model breached 30 percent, a U.S. recession has always followed. What we present here is intended to facilitate a discussion by middle market businesses on preparing for the end of the business cycle through balance sheet considerations organized around budgetary, supply chain, banking, talent, productivity and efficiency needs inside their businesses.
The end of U.S. business cycles are never slow, but easily observable events. When the U.S. economy falls into a recession, it tends to fall off a cliff driven by a combination of endogenous and exogenous shocks or policy mistakes. Thus, a notable decline in fixed business investment, a drop in inflation-adjusted spending, a deterioration in business sentiment and key credit and corporate spreads—all of which are incorporated into our preferred recession model—can, on the margin, be decisive factors in creating the conditions for a recession.
Many old rules of thumb that worked before the fracture of the domestic economy a decade ago during the Great Recession are no longer useful in identifying the end of the modern business cycle. For example, the old saw “a recession is comprised of at least two consecutive quarters of negative growth” does not necessarily accurately identify that the economy has fallen into recession.
Instead, we prefer the National Bureau of Economic Research’s (NBER) definition of a recession—a significant decline in economic activity spread across the economy, lasting more than a few months, normally visible in real gross domestic product (GDP), real income, employment, industrial production and wholesale-retail sales.
When assessing the transmission mechanism between the aforementioned risks to the economic outlook, one should focus on real income, employment and real GDP, in addition to a number of other factors. Those include defaults on home and auto loans, rising credit card debt and declines in consumer and business confidence. What follows are some useful metrics for middle market businesses to track and gauge recession risk.

THE YIELD CURVE AS A RECESSION INDICATOR
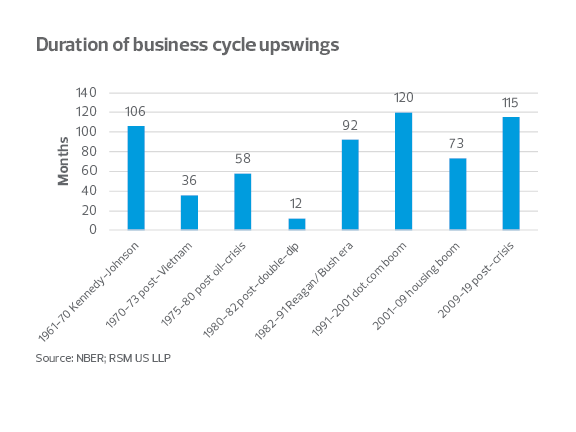
The U.S. economy has been growing for the past nine years, making this current recovery just months short of becoming the longest expansion in modern history. The knee-jerk reaction may be to assume the economy is ripe for a setback.

Meanwhile, analysts have increasingly pointed to the flattening yield curve, which has flirted with inversion at points along the curve as a harbinger of recession. The 2.75 percent yield on the 10-year Treasury is only 25 basis points higher than money market rates. Does this mean that U.S. economic growth is stalling and that a recession is inevitable?
Follow the yield curve
David Andolfatto and Andrew Spewak of the Federal Reserve Bank of St. Louis indicated in a recent analysis that the yield curve has flattened and inverted before each of the past three recessions. They also noted the following:
- Curve inversions were a poor predictor of the timing of the recession.
- Most recessions were triggered by events, ranging from oil crises and war to the bursting of an assetpriced bubble like the dot-com bubble before the 2000 recession or the housing-market bubble that led to the Great Recession.
- Slow-growing economies are more likely to be sent into a recession in reaction to a shock than a healthy, fast-growing, high-interest-rate economy. “In this way, an inverted yield curve does not forecast recession; instead, it forecasts the economic conditions that make recession more likely.”
It’s fair to think that the current recovery could follow suit. After all, there has already been a shock in the financial sector: The stock market correction of late 2018 wiped out a year’s gains as decreased earnings expectations grew out of investor concern that the Federal Reserve’s monetary policy tightening regime was too severe and too soon, considering the constant threats to international trade and the moderation of global growth.
No business cycle is the same
Even so, not all business cycles are the same, and the current expansion is anything but cookie-cutter for the following reasons:
- Monetary policy has never been so aggressively accommodative for so long in the modern era.
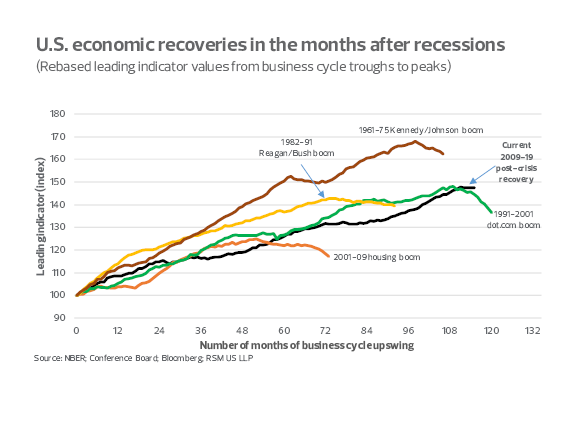
- The recovery after the Great Recession, though long-lived, has grown at a moderate pace and more in line with what appears to be a secular decline in U.S. economic activity than what we might normally expect after a downturn.
- Real interest rates have never been so low for so long, reflecting perhaps a new slow-growth paradigm.
- The manufacturing sector has undergone a shift in structure that was accelerated by the recent financial crisis and Great Recession, with traditional domestic production replaced by a global supply chain.
- Global interest-rate compression (resulting from a secular decline in global inflation) and the safe-haven demand for Treasurys by foreign investors have played a role in pressuring long-term interest rates lower.
The repercussions of the Great Recession have been undeniably severe, widespread and long-lasting. Not only was there a huge loss of income, but the years of lost employment and lost output are unlikely to be recovered anytime soon, if at all. The immediate loss was compounded by a reduction of output due to the retirement of the baby-boomer generation and an aging global demographic. We have been calling for U.S. growth of less than 2 percent in 2019, with even that growth rate at risk given the government shutdown(s) and the administration’s attempts to unwind the global supply chain. Therefore, it could be argued that the stage has already been set for a slow-growing economy to be pushed into recession by a crisis or event as outlined earlier.
CORPORATE DEBT AND YIELD SPREADS
Issuance of corporate debt underwent a shift of structure from 1979 to 1989 as junk bonds emerged as an alternative to equity financing of takeover and merger and acquisition activity. Since the 1990s and until recently, issuance remained in the range of 40 to 45 percent of nominal GDP.
Before the recent financial crisis, issuance appeared to follow the business cycle, increasing relative to diminished output and as interest rates were lowered in response. Interest rates have been abnormally low for the decade following the crash, and corporate debt is now at 46 percent of nominal GDP.
The spread between investment-grade corporate bonds (with Baa ratings) and 10-year Treasury bonds has typically decreased as economic activity picks up and perceptions of risk move lower. The recent increase in the Baa spread is therefore, a potential signal of a slowdown in activity.
One might expect that high-yield bonds (the securities formerly known as junk) would be more attuned to perceptions of risk. While Q3 2018 economic growth hit 3 percent, spread between high-yield bonds and 10-year Treasurys immediately began moving higher, perhaps suggesting more risk to forecasts of growth in coming quarters.
LABOR SECTOR
The labor market will often lag in the business cycle, often due to contractual issues or production timing. After decelerating since 2015, nonfarm payrolls re-established its upswing in 2018 in line with the acceleration of output growth.
The growth rate in hours worked accelerated in 2016. With the potential of an increased labor demand, wages would push higher, increasing disposable income and spending, and attracting more of the population back into the labor force, increasing potential output.
Hourly earnings peaked in 1981 and then dropped precipitously as the political support for collective bargaining evaporated and as manufacturing was offshored to cheaper labor locations. Hourly earnings have been recovering along with the economy, with the growth rate moving above post-1984 long-term averages.
Productivity growth, thought to be an essential factor for increased and sustained levels of output growth, remains low, setting the stage for a low-growth regime and the greater likelihood for a recession.
CONSUMER SECTOR
The consumer sector approximately comprises two-thirds of the U.S. economy, with spending slowing to about 2.8 percent in Q4, while Q3 real GDP grew at a 3 percent rate.
Economic theory suggests that household consumption can be more dependent on perceptions of future rather than current income growth. The latest available retail data suggested the possibility of a slight slowdown in household spending.
The role of consumer confidence in household spending
There are three major consumer sentiment surveys, with The Conference Board and Bloomberg indices reporting increasing confidence since 2017, while the University of Michigan (UMich) survey reports a flattening of confidence since the end of 2016.
The UMich survey confirms what looks to be a late-in-the-business cycle stabilization of consumer spending. The Conference Board survey suggests a more optimistic outlook for the consumer sector.


