The Real Economy

How pandemic savings might have saved the day

May 03, 2021
#
Economics The Real Economy

An avalanche of spending is waiting to be unleashed by the American household. Add that to the expected investments by the corporate sector to improve their productivity, and the result is a robust consensus forecast of 6.4% growth in gross domestic product—RSM predicts 7.5%—for this year. And that number will most likely be upgraded following the blowout March retail sales data, as well as the robust personal income, spending and savings data to close out the first quarter.

The strong recovery will depend on the efficacy and distribution of the vaccines, as evidenced by the coronavirus outbreaks afflicting numerous states. But we are confident that the year will end with the unemployment rate as low as 4.1% and the economy growing by 7.5% on a yearly basis, which is enough to support 10-year Treasury yields at 1.9%.

People have had enough of this pandemic, and are eager to have a beer and pizza at their favorite joint or go to an NBA playoff game. The pictures of London’s pubs—finally open again after the U.K. beat back the virus’ resurgence—provide a more compelling narrative than the economic data perhaps ever can.

Yet with millions of people still out of work and living on limited incomes, where will the spending money come from? That simple question deserves a nuanced answer. The policy mix pursued by the fiscal and monetary authorities early in the recovery may seem to some like pushing on a string and risking inflation.

We do not agree. The mix of savings, pent-up demand for services and what we think will be an increase in productivity-enhancing investments by businesses will provide just the opposite. We see a multiyear period of above-trend growth, with two dynamics in play:

First, the trade war and the pandemic have afflicted different parts of the economy at different times. The manufacturing sector—which was in recession before the pandemic pushed the whole economy over the edge—appears to be growing once again. Employment in the goods-producing sector has already reached 95% of pre-pandemic levels.

And employment and spending among the white-collar set—those who were able to work at home—proved to be resilient with the maturation of online shopping, which has supported a segment of the service sector. Our colleagues at tracktherecovery.org think that households with more than $60,000 in income transitioned into recovery, and we agree.

Second, the shock from the pandemic has led to a much stronger fiscal and monetary response than if the downturn had been limited to manufacturing. Income streams for low-income households have been supported and will continue to improve as expanded child care benefits begin in July. Low-income households tend to spend all of their income, and the multiplier effect of income support for those households is greater than for upper-income households. This is not only a function of accommodative monetary policy, but is also a result of nearly $6 trillion in fiscal aid, or roughly 26% of GDP, to address the pandemic.

So we would argue that increased spending this year will come from a labor force that will be getting back to work, from government benefits that will continue to support lower-income households, and from the use of the $1.6 trillion in excess household savings compared to the pre-pandemic average of $700 billion.

Because savings can be a drag on the economy, we’ll discuss the origins of the huge increase in household balance sheets and how that might form the basis of a sustained recovery.

Savings, income and spending 

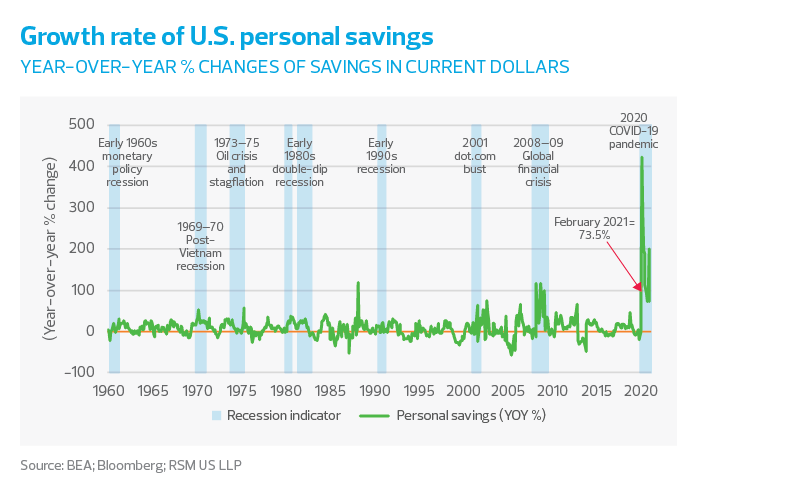
Let’s start with the outsized increase in personal savings last year that, no matter how you slice it, took more than $5 trillion off the table at the depths of the pandemic. Twelve months later, savings remain 73% higher than pre-pandemic norms.

That increase in savings is substantially lower than the 400% increase that developed in April 2020, when no one really knew if the pandemic could be contained. But note that for the next 12 months, those year-over-year comparisons will be distorted by base-year effects.

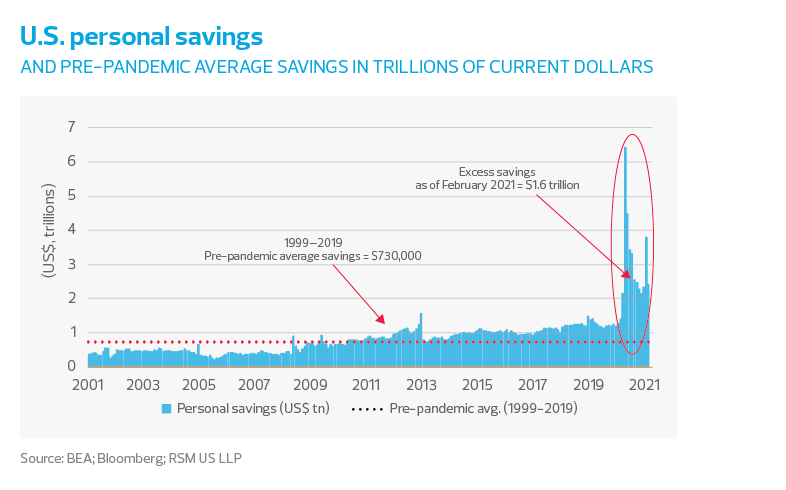
US personal savings
chart - savings - TRE 05/21 - chart 1
Growth rate of US personal savings
chart - savings - TRE 05/21 - chart 2

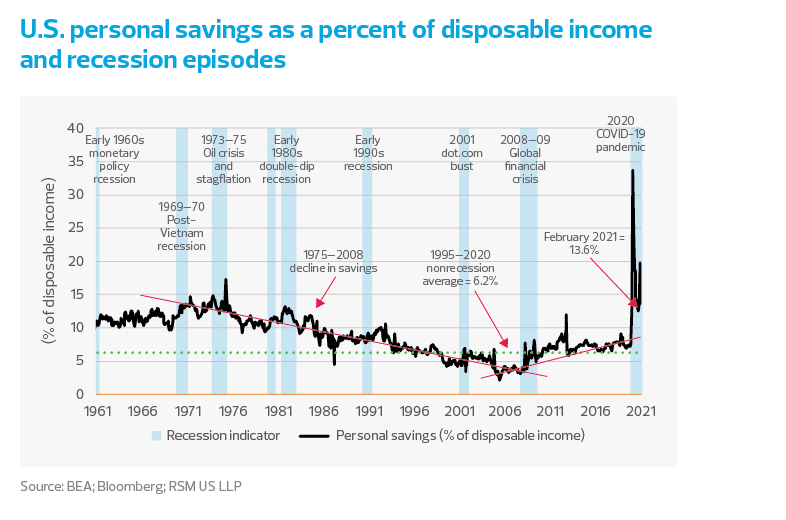
Savings is what’s left after a household spends its income. So perhaps the best way to judge household behavior is to look at personal savings as a percentage of disposable income. During nonrecession months before the pandemic, U.S. households saved about 6.2% of their disposable income. By April 2020, households were saving 34% of their disposable income. The savings rate has receded to 13.6% as of February, but that’s still twice as much as its 1970-2019 average.

MIDDLE MARKET INSIGHT: The mix of savings, pent-up demand and an increase in productivity-enhancing investments by businesses will result in a multiyear period of above-trend growth.

The normalization of savings is important for sustainable growth. A lack of spending and the combination of an aging demographic and reduced immigration would make the United States heir to Japan’s lost decade. Yet that is exactly why the fiscal and monetary authorities pursued such unorthodox policies to address the economic shock of the pandemic.

Because of the variation of savings rates among nations, we could say that savings are part cultural. But in our economy, we’ve found that savings is dependent on each household’s life cycle and circumstances. We tend to spend more as we’re starting out and then save more as we mature.

There are also social pressures and business-cycle factors such as perceptions of employment security that determine individual savings rates. And there is the effect of income on savings—the more income you have, the more there can be saved above day-to-day expenses.

As such, savings as a percent of disposable income declined from 1975 to 2008, which is perhaps emblematic of the era of consumerism. Savings reached its low point during the housing bubble and then began to rise again after the shock of the 2008 financial crisis and recession.

Before the pandemic, savings as a percent of disposable income was just above its long-term average, perhaps emblematic of low wage growth and diminished employment choices.

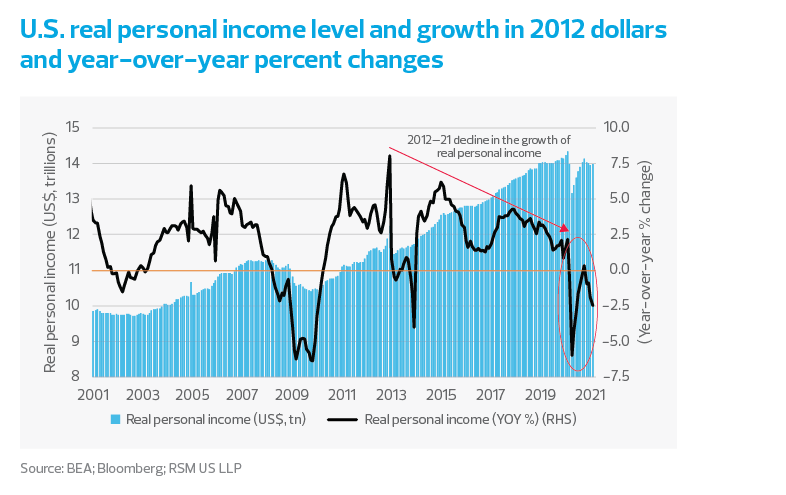
To complete the determination of savings rates, personal income in inflation-adjusted terms had been in general decline from 2012 to 2020 as higher-paying manufacturing jobs were replaced by lower-paying service-sector employment.

The growth rate of real personal income turned negative during the pandemic and remains about 2.5% lower as of February than before the pandemic. We would argue that diminished expectations for higher rates of income would lead to increasing rates of precautionary savings evident after the Great Recession.

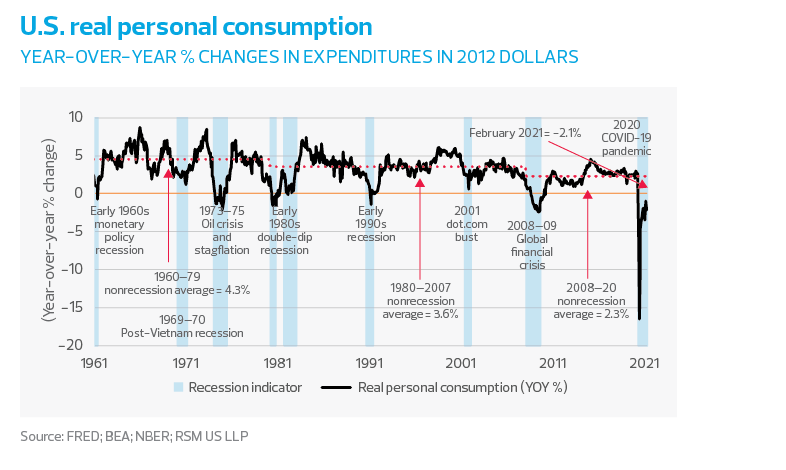
Personal consumption has been in gradual decline since the go-go 1960s and 1970s, dropping lower after each major downturn and as the population has aged. Household spending remains 2.1% lower in February relative to February 2020, though much closer to normal than during the depths of the pandemic. This is a promising sign.

MIDDLE MARKET INSIGHT: Once the economy reopens, demand for services will return with a vengeance and a look back at the monetary and fiscal policies of the pandemic will show that they paid off.

US personal savings as a percent of disposable income and recession episodes
chart - savings - TRE 05/21 - chart 3
US real personal income level and growth in 2012 dollars and year-over-year percent changes
chart - savings - TRE 05/21 - chart 4
US real personal consumption
chart - savings - TRE 05/21 - chart 5

Pandemic policy changes and the growth of savings deposits

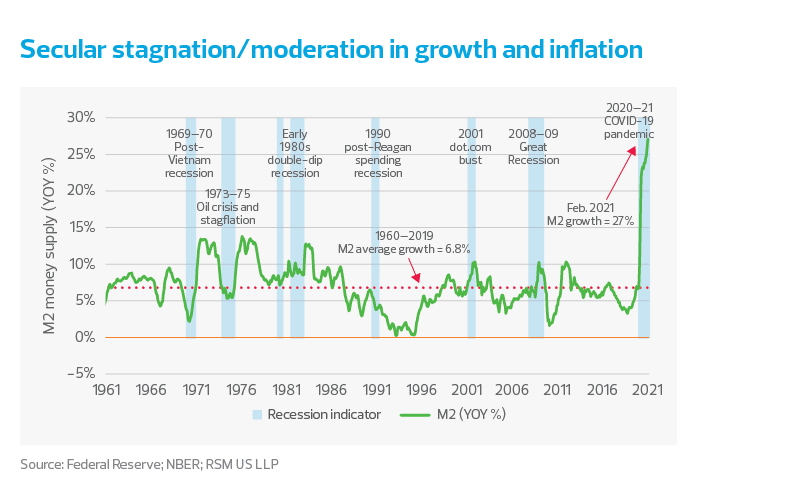
The combination of the Federal Reserve’s asset purchase program and the government’s pandemic relief efforts has flooded the economy with liquidity. In fact, the amount of cash and easily accessible money (the M2 money supply) has grown at unprecedented rates during the pandemic. As of February, M2 was 27% higher than a year before, a growth rate that several years ago would have financial commentators debating how high inflation would rise.

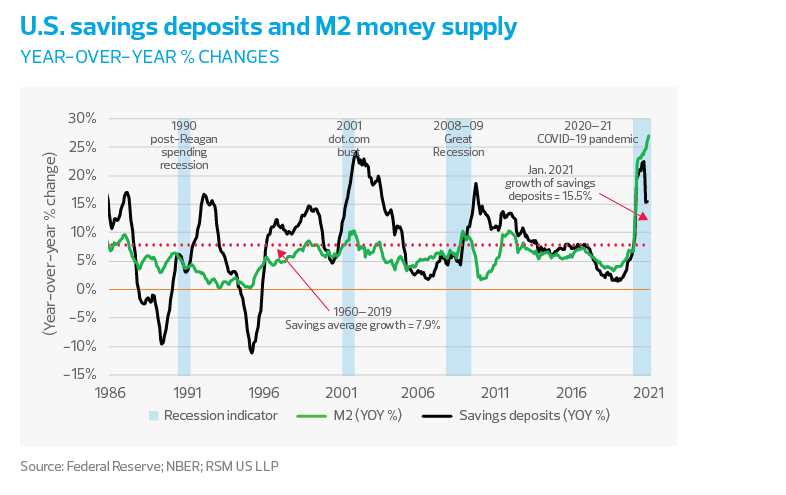
The second figure below helps to explain why it was necessary to flood the market with liquidity and why the increase in money supply might not be a threat to inflation stability. While the monetary and fiscal authorities were busy injecting cash into household balance sheets, consumers and businesses were hoarding much of that cash in savings deposits. (And if there’s low demand, there can’t be high inflation no matter how much cash there might be.)

We attribute the increase in deposits to precautionary savings. Instead of going out to shop, consumers were huddled in their homes, hoping for the best but expecting the worst. And with millions of households limited to living off unemployment benefits while others were constrained by income uncertainty and limited opportunities to spend, consumption plunged. At the same time, small businesses held back on spending, more interested in how to pay the rent or meet payrolls and less willing to risk capital on investments.

So to an extent, the best efforts of the monetary and the fiscal authorities might appear to be pushing on a string. But as one takes a look at the accumulation in pent-up demand in addition to savings, once the economy reopens, demand for services will return with a vengeance and a looking back at those policies will seem nothing like pushing on a string.

With the commercial sector’s willingness to invest limited during the pandemic and the consumer sector less willing to spend, the growth of savings deposits rose as high as 22.5% on a year-over-year basis, far above its pre-pandemic average growth rate of 7.9%. Though the growth of savings deposits has decelerated to a 15.5% rate—which is progress—that’s still twice what might be expected within a normal economy.

Secular stagnation/moderation in growth and inflation
chart - savings - TRE 05/21 - chart 6
US savings deposits and M2 money supply
chart - savings - TRE 05/21 - chart 7

How excessive are savings?

The end result of abnormal consumer behavior and the prompt policy response to a severe demand shock caused by the pandemic is excess savings.

A recent Federal Reserve Bank of New York analysis compares the $1.6 trillion estimate of excess savings to the $130 trillion in net worth of U.S. households. The analysis neatly breaks down the increase in savings and its impact on future spending as follows, along with our commentary.

Excess savings are the accounting counterpart of extra government debt. Benefits paid to households are not all spent, but are retained. We are borrowing from ourselves, and household accumulation of savings can be viewed as a cushion to repay ourselves (through higher taxes) in the future.

Excess savings are mostly held by … savers. Though we have no way of knowing for sure what households did with government benefits during the pandemic, we can assume that lower-income households used all of their money to keep food on the table, better-off households used some of the money to pay down debt, and affluent households retained some portion of the money as precautionary savings. As a result, the Federal Reserve Bank of New York’s analysis suggested that “fewer households should face financial hardship as aggregate conditions improve.”

The analysis added that some of the excess savings can be attributed to a lack of opportunity to spend during the pandemic, which we argue would add at least something to the potential for increased spending financed by a drawdown of those savings.

This, however, leads to the unequal nature of the pandemic and the authors’ third point regarding the pandemic’s particular impact on the service sector.

Excess savings are unlikely to unleash pent-up demand for services.

Note first that the authors said, “This conclusion does not rule out a strong economic recovery from the virus shock. It only implies that spending out of excess savings won’t be one of its major drivers.”

The authors contended that the propensity for spending has not changed dramatically over the course of the pandemic, and that consumer spending of benefits during the recession last year was much the same as during the 2008 financial crisis-induced Great Recession.

Final thoughts

The service sector will have suffered unrecoverable losses of income and employment disruptions that are likely to continue after the pandemic subsides. Yes, we will begin going to our favorite restaurant for a meal, but that won’t fully compensate waiters for lost tips over the past year. And your one visit to your hair stylist cannot make up for the 12 months of foregone or makeshift haircuts.

We would also add that although the advent of online shopping has allowed households to maintain spending levels, it’s just not going to the same businesses. The damage to small businesses is substantial, and it could take a while for small businesses’ investments to catch up with the public’s desire to shop at a neighborhood store.

As the authors write, “The end of the pandemic in itself is unlikely to turn them from savers to immediate spenders.”

Yes, precautionary savings is likely to continue for a while, but that does not diminish the likelihood of a burst of spending, especially when vaccination coverage nears completion.

We would agree that the burst of spending might not come solely from the excess savings. Rather, we expect households to hold on to some of their savings until deeper into the recovery when employment is more secure and wages begin to rise on a sustained basis. The burst of spending will arise from an all-of-the-above combination of increased employment opportunities and government benefits, backed with the added security of accumulated savings.

In our assessment, the absence of financial hardship—afforded by government benefits—and the restoration of confidence in the government’s ability to respond to hardship will allow for a quicker recovery than prior shocks to the economy. 

RSM contributors

The Real Economy

Monthly economic report

A monthly economic report for middle market business leaders.

Industry outlooks

Industry-specific quarterly insights for the middle market.