The Real Economy

How government payments helped restore household balance sheets

#
Economics The Real Economy

Consumers continued their pandemic-era rebalancing of household finances in the first quarter, shedding credit card debt and home equity lines of credit. These adjustments to household balance sheets appear consistent with increases in government transfers and changes in buying habits during the pandemic. 

This underscores the powerful release of pent-up demand that will be the foundation of this year’s economic boom and will provide the overarching narrative for the first phase of the recovery and expansion.

Government efforts to maintain income streams and spending during the pandemic have been successful, as evidenced by the recoveries in retail sales and in personal consumption expenditures since the depths of the pandemic.

In one sense, those government transfers to households have in a modest way helped millions of Americans rehabilitate their balance sheets. Over a decade ago, the government took a not too dissimilar approach, but with major banks, when it sponsored a de facto bailout of those large and systemically important institutions.

But not all of those fiscal transfers have gone into spending. Instead, a significant portion is being retained as outright savings or through the paying down of debt. Our estimation is that households will largely save 30% of those government transfers, use 30% to pare down debt and spend 40% of them over this year and next.

We categorize paying down debt as a form of precautionary savings, in which households give themselves more room to maneuver should expenses once more overwhelm available income during the inevitable economic shakeout of the post-pandemic recovery.

This reduction of debt should also reinforce the improvements in household balance sheets and the overall economy as Americans gain confidence in their own financial conditions.

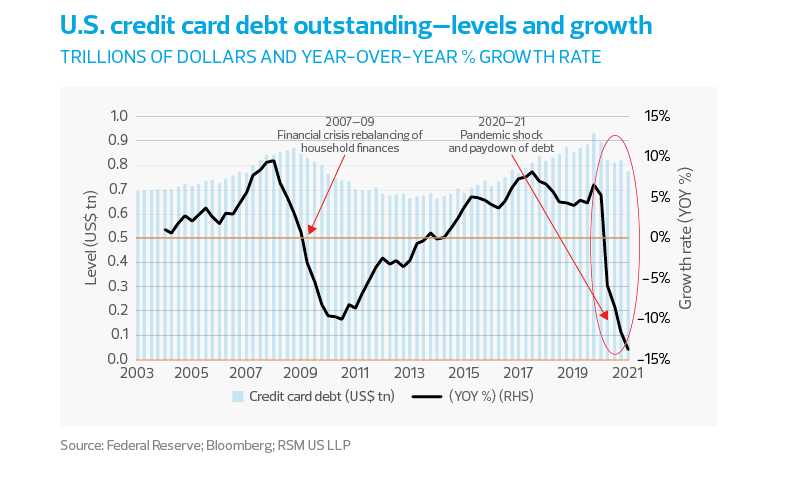
Credit card debt was reduced by $157 billion in the five quarters of the pandemic (from the end of 2019 through the first quarter of 2021), including a $49 billion drop in the first quarter. Credit card debt was growing at a five-year average rate of 5.4% per year before the pandemic, but grew by only 2.6% on a year-over-year basis in the first quarter of 2021.

Home equity lines of credit were reduced by $55 billion during the five quarters of the pandemic, including a drop of $14 billion in the first quarter of 2021. Home equity financing has been in general decline since the early 2000s, with negative growth since 2012. 

According to an analysis by the Federal Reserve Bank of New York, in total, “non-housing balances declined by $18 billion, with increases in auto and student loans offset by the declining credit card balance.”

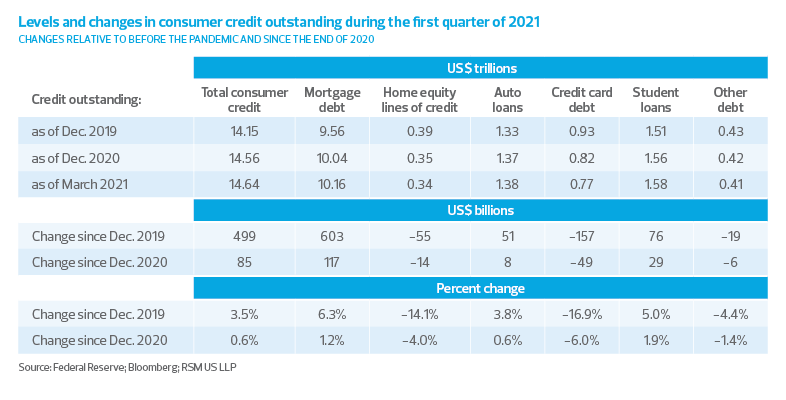
Levels and changes in consumer credit outstanding during the first quarter of 2021 chart
chart - households - TRE 07/21 - chart 1

First quarter consumer credit in five charts

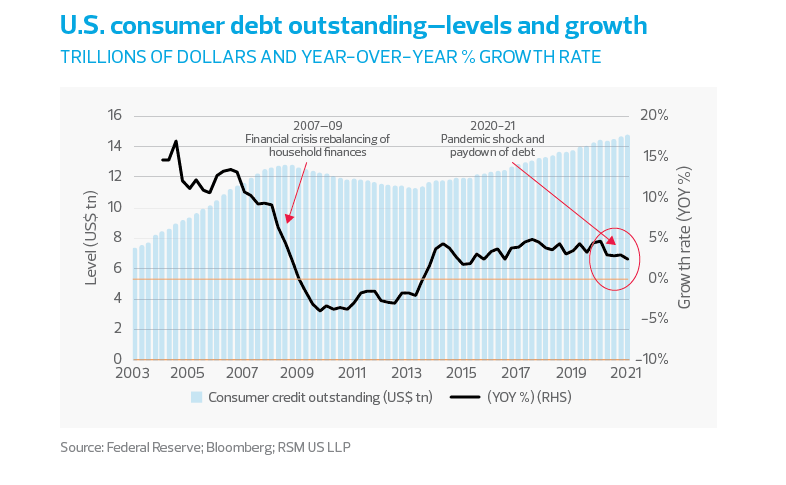
Total consumer credit grew by 0.6% in the first quarter compared to end-of-year 2020. On an annualized basis, that would be a growth rate of 2.4% in 2021 were first-quarter growth to continue for the rest of the year. By comparison, total consumer credit had been growing at an average 3.5% yearly rate in the five years before the pandemic.

US consumer debt outstanding-levels and growth chart
chart - households - TRE 07/21 - chart 2

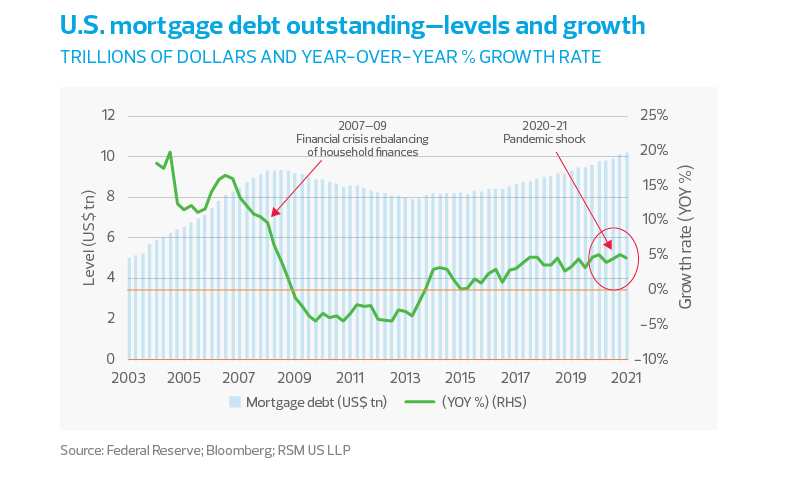
Mortgage debt grew by 1.2% in the first quarter compared to end-of-year 2020. On an annualized basis, that would be a growth rate of 4.7% in 2021, compared to its five-year pre-pandemic average 3.0% yearly rate.

At least some of those increases in mortgages outstanding can be attributed to shifts in housing preferences and the hot housing market during the pandemic.

US mortgage debt outstanding levels and growth
chart - households - TRE 07/21 - chart 3

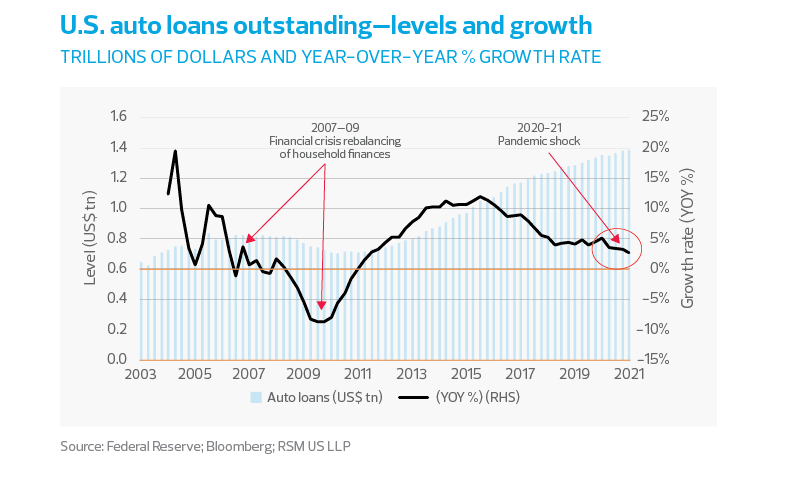
Auto loans grew by 0.6% in the first quarter compared to end-of-year 2020. On an annualized basis, that would be a growth rate of 2.3% in 2021, compared to its pre-pandemic five-year average 7.4% yearly rate.

This runs counter to the narrative regarding the drop in inventory. But a consumer shift to less expensive used cars and to general household cost-cutting most likely account for the long-term slowing growth of auto loans.

US auto loans outstanding levels and growth
chart - households - TRE 07/21 - chart 4

Credit card debt declined by 6.0% in the first quarter compared to end-of-year 2020. On an annualized basis, that would be a drop of nearly 22% in 2021, compared to its five-year pre-pandemic average 5.4% yearly growth rate.

MIDDLE MARKET INSIGHT: A growing reluctance to accumulate debt among households might not become a drag on the economy if households instead reduce precautionary savings and wages rise.

This growing reluctance of households to accumulate debt, should it continue beyond the vaccination program, might not become a drag on the economy if households reduce their precautionary savings, wage increases sustain their pandemic gains, and infrastructure programs accomplish their goals.

US credit card debt outstanding levels and growth
chart - households - TRE 07/21 - chart 5

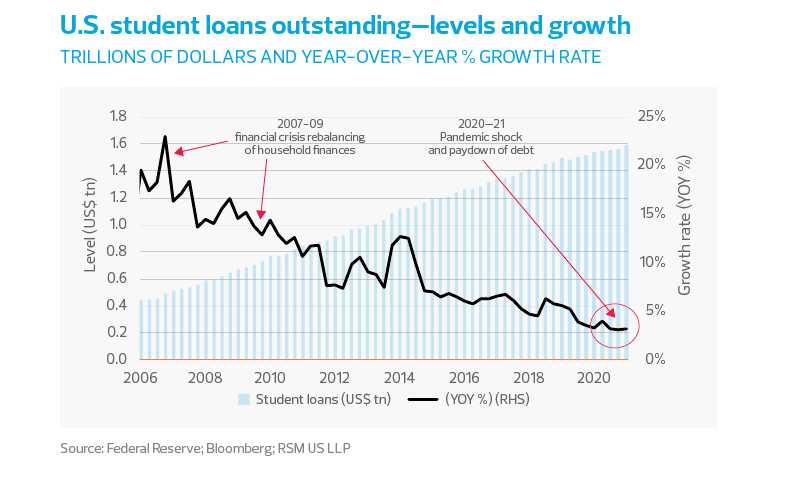
Student loans outstanding grew by 1.9% in the first quarter compared to end-of-year 2020. On an annualized basis, that would imply an increase of 7.7% in 2021, compared to its pre-pandemic five-year average 5.8% yearly growth rate.

Increased student loan debt should not be confused with the rising cost of higher education, which is partly a reflection of families’ willingness to pay. Still, a persistent increase in education costs is likely to have a sustained effect on household expenses and an impact on overall inflation.

US student loans outstanding levels and growth
chart - households - TRE 07/21 - chart 6

Composition of and long-term trends in consumer debt

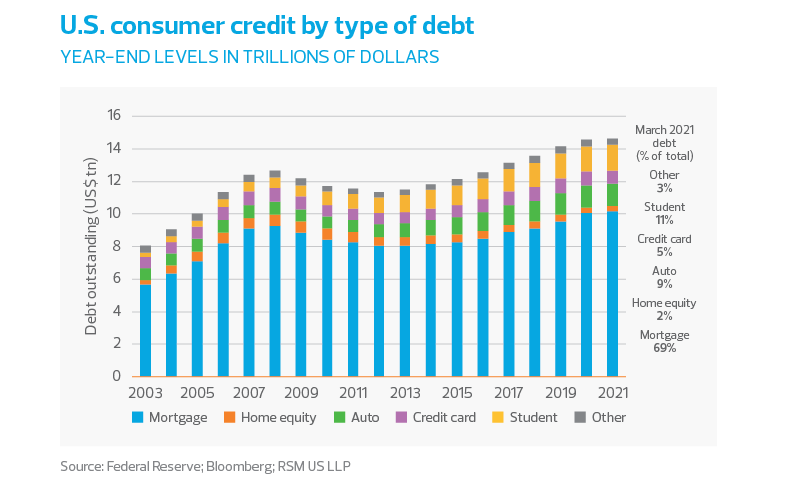
Mortgages hold the largest share (69%) of consumer debt and form the backbone of modern American life and wealth accumulation. Housing costs are followed by student loans, which now make up 11% of consumer credit; auto loans at 9%; and credit card debt, which holds a 5% share.

The largest increase in the composition of debt has been in student loans, which grew from 5% of total credit in 2008 to their 11% share in 2021. Home equity lines of credit—which were once so popular and in 2008 held a 6% share of total consumer credit—now hold a 2% share.

US consumer credit by type of debt
chart - households - TRE 07/21 - chart 7

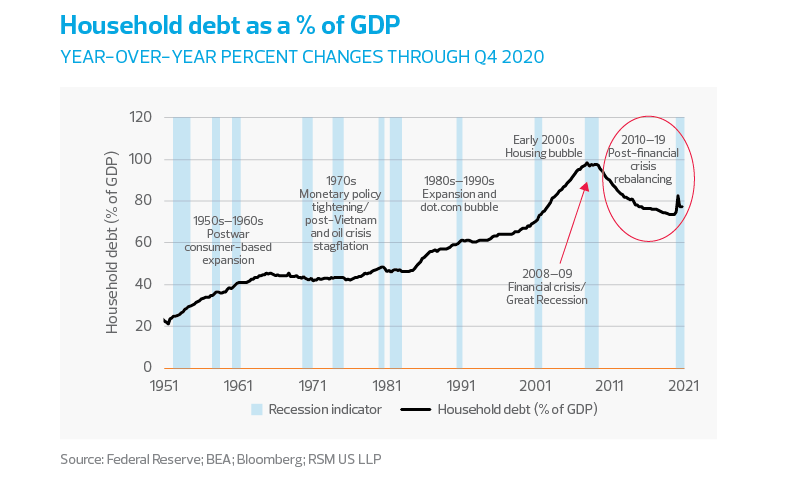
The shedding of debt during the pandemic—if it continues—would be part of a rebalancing trend after the postwar era of consumerism. The turning point could have resulted from lessons learned from the early 2000s housing bubble and subsequent financial crisis.

The largest increase in the composition of debt has been in student loans, which grew from 5% of total credit in 2008 to their 11% share in 2021.

But the restructuring of household finances is more likely to have resulted from the decline of wage growth after the Great Recession, when the manufacturing sector was hollowed out, worker representation diminished, and wages and worker benefits barely kept up with normal levels of inflation.

The takeaway

We are in a cycle of an inordinate amount of savings pressuring the returns on investment lower and moderating wages, inflation and economic growth. Whether this era of belt-tightening continues might depend on the ability of the government to invest in a re-imagined economy and to foster a new avenue for prosperity. But re-imagining a 1950s economy is no solution—for today or for the long term.

Household debt as a % of GDP
chart - households - TRE 07/21 - chart 8

The Real Economy

Monthly economic report

A monthly economic report for middle market business leaders.

Industry outlooks

Industry-specific quarterly insights for the middle market.