The Real Economy

Hotel occupancy data: It's only half the story

September 08, 2020
#
Economics The Real Economy Real estate

Hotel occupancy is typically measured by the consistent supply of rooms, and on the surface recent numbers have been looking more favorable despite the continuing COVID-19 pandemic, with occupancy finally eclipsing 50%. Occupancy rates were 50.2% in the week ended Aug. 15, up from 49.9% a week earlier, and 46.2% a month earlier.

But given that the pandemic has forced closures of many U.S. hotels, and that reported occupancy rates factor in those closures, occupancy rates are not providing the full picture of distress in the industry. Meanwhile, unless hotels are given additional financial relief, more closures will ensue, artificially inflating occupancy and making it an even less reliable metric.

Total room inventory

The hospitality data firm STR has created a new data point, total-room-inventory methodology, or TRI, to factor in the temporary hotel closures. Until all temporarily closed properties have reopened, TRI will lag occupancy. That is because room supply, its denominator, is greater than room bookings, its numerator.

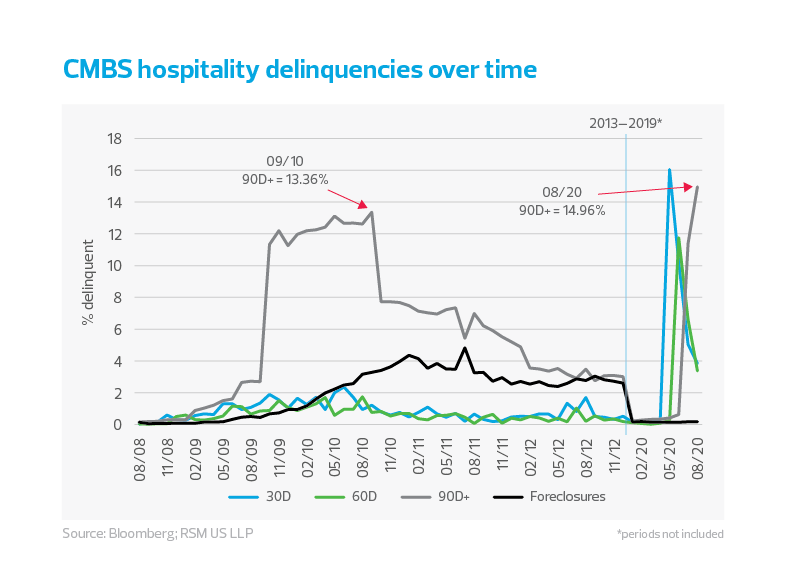
CMBS hospitality delinquencies over time
chart - occupancy - TRE 09/20 - chart

For instance, U.S. occupancy for July was 47% but TRI for the month was calculated at 44.6%, showing a 2.4% total variance in rates and a 5.2% difference.

The view on the ground offers an equally sobering perspective. Chip Rogers, chief executive of the American Hotel and Lodging Association, told Northstar Meetings Group that as many as 8,000 hotels might close by the end of September, adding, “Right now, many hotels are struggling to service their debt and keep their lights on.”

Furthering the negative outlook, some 23.4% of commercial mortgage-backed security (CMBS) loans, which finance many hotels, were more than 30 days late in July, totaling $20.6 billion. To put that into context: Only 1.34% of hotel CMBS loans were in default in July 2019, according to Trepp. The highest delinquency rates relate to metro areas with a dependence on tourism and business travel, including New York City (38.7% delinquency, $1.475 billion in loans) and Chicago (53.8%, $976 million). We project that the percentage difference between traditional occupancy and TRI will continue to grow as delinquent hotels become permanent closures, further reducing the total available rooms supply in the United States.

The hospitality industry is not having the V-shaped recovery we all hoped for, as consumer demand remains dampened by the lack of a COVID-19 vaccine. The difficulties facing investors and hotel operators regarding reopening are multifaceted and complex. At the very least, a multipronged focus on safety protocols, appropriate staffing and realistic scope of demand is required to assure effective and profitable operations.

RSM contributors

The Real Economy

Monthly economic report

A monthly economic report for middle market business leaders.

Industry outlooks

Industry-specific quarterly insights for the middle market.