The Real Economy

Consumer outlook critical to 2020 growth

January 05, 2020
#
Economics The Real Economy Consumer goods

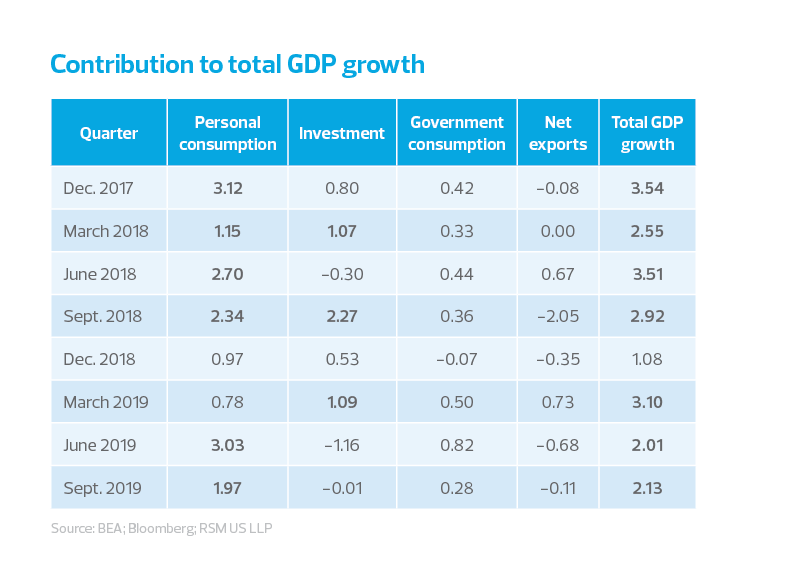
It is nearly impossible to overstate just how important the consumer has become to the health of the economy in 2020. Because fixed investment and net exports have become a drag on growth, household consumption remains the most important driver of overall economic activity, and the difference between modest growth near 2% and an end to the current business cycle. 

Consumption has been king since the second quarter of 2014—when the recovery from the Great Recession had finally taken hold, and the unemployment rate was approaching what was then thought to be its equilibrium level. The role of the American consumer grew even more important in late 2018, becoming the only consistently positive contributor to gross domestic product growth.

U.S. consumer spending—officially known as personal consumption—has been the most consistent contributor to U.S. economic growth in the recent quarters, accounting for roughly 70% of overall economic activity. But that strength has not been the result of rising wages among low-wage households; instead, it’s the result of the high-income households’ spending fueled by deficitfinanced gains in equity-market investments.

Monthly contribution to total GDP growth table
chart - consumer outlook - TRE 01/20 - chart 1

This point is critical to understanding what is driving consumption and the risks to the economic outlook: Outlays are driven by the two upper quintiles of income earners. In short, 40% of households are responsible for roughly 60% of spending. In turn, this suggests that those households that are heavily invested in asset markets are sensitive to volatility in those markets.

That’s why the stock market’s decline in late 2018, when the S&P 500 fell by 13.6%, resulted in the halt of household spending in December. That was followed by outright declines in retail sales during the first 60 days of 2019, before growth in spending resumed on the back of a recovery in asset prices and bonus payments to higherincome households. 

The current business cycle

The world economy is slowing, which should not be unexpected near the end of a business cycle. In past business cycles, American trading partners could rely on investment and consumption to jump-start a moribund world economy. That would spur a virtuous circle of domestic spending and investment spilling over into increases in foreign demand and economic activity. But that is not likely to be the case this time around, given the attempted repatriation of supply chains and disruption of the rules-based framework for global trade.

MIDDLE MARKET INSIGHT With U.S. trade policy and tariffs still showing signs of volatility heading into 2020, it is essential that middle market companies build resilience into their value chains, particularly around managing input costs. 

So with global consumption and investment thwarted by tariffs, as well as policy polarization in Washington, the U.S. consumer sector is left as the last one standing.

But can we rely on the consumer sector to continue to fuel growth in 2020?

In our estimation, the Tax Cuts and Jobs Act of 2017 stimulated spending. While the tax cut peaked in the third quarter of 2018, the reduction in the corporate tax rate has spurred a wave of stock buybacks that has lifted equity prices. That, in turn, has benefited the upper-income consumer and supported spending throughout 2018-19. As our analysis suggests, the increase in wealth and after-tax income for the upper quintiles might, in fact, have been essential to preventing the economy from drifting into what could have been an outright contraction.

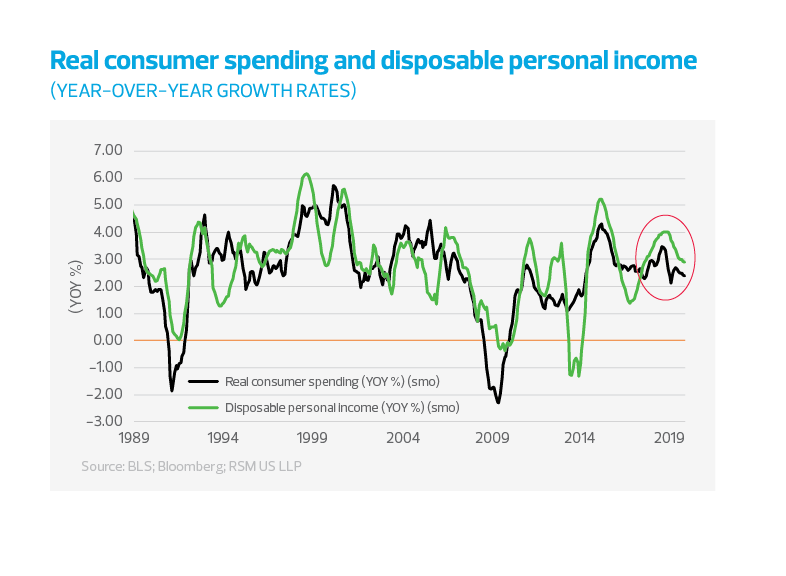
It may not last, though. Not only could the lack of investment become harmful to potential long-term growth, but the benefits of the tax cuts also appear to be unwinding, with the diminished growth of disposable personal income having the potential to hurt consumer spending.

Real consumer spending and disposable personal income
chart - consumer outlook - TRE 01/20 - chart 2

Welcome to the gig economy

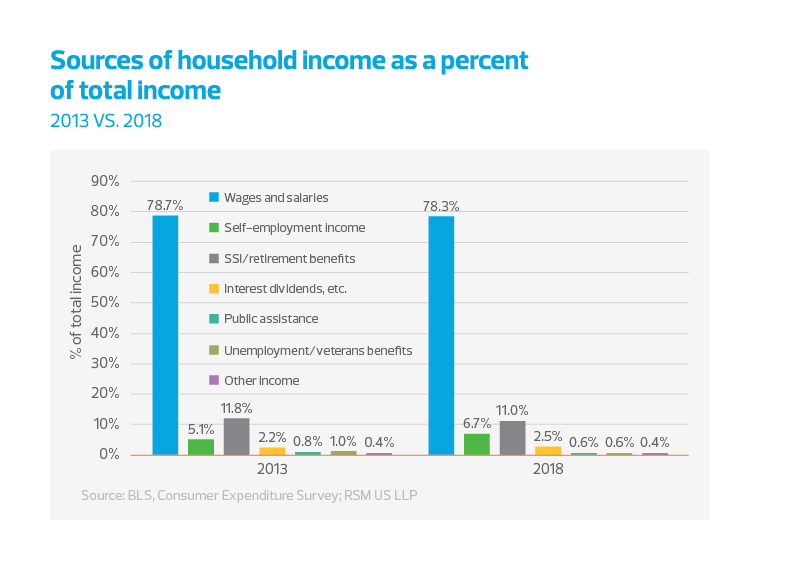
In general, more than two-thirds of Americans still earn a paycheck. But according to yearly surveys by the Bureau of Labor Statistics, the share of income derived from wages and salaries declined a bit over the past five years, while self-employment earnings rose from 5.1% of total sources of income in 2013 to 6.7% in 2018.

More surprising is that the share of Social Security and other retirement benefits—the other most significant source of income—has been decreasing since 2013, most likely because of the poor performance of fixed-income investments in an era of low interest rates. As baby boomers continue to retire—and if their spots in the labor force are not replaced by immigrants or because of low birthrates—we might expect the share of income derived from retirement benefits to eventually increase.

Sources of household income as a percent of total income
chart - consumer outlook - TRE 01/20 - chart 3

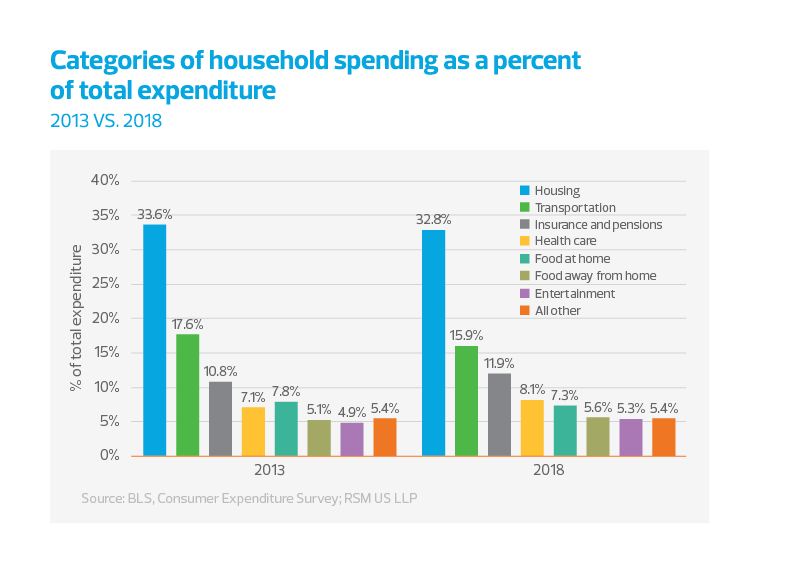
The trends in household spending also reflect the times. While a third of household expenses still go toward housing, transportation expenses have dropped from 17.6% of total income in 2013 to 15.9% in 2018. That might be symptomatic of changing tastes in lifestyles and commuting, the low cost of fuel and the decrease in new automobile sales.

Another significant change is the increased share of health care in the economy—from 7.1% of total spending in 2013 to 8.1% in 2018—which might play a part in the 2020 political discourse.

And finally, although spending on food at home decreased from a 7.8% share of total spending to 7.3% in 2018, spending on food away from home increased from 5.1% to 5.6%.

In summary, about 50% of household spending goes to housing costs and transportation. Spending on retirement funds and health care comprises about 20%, 17% goes to entertainment and miscellaneous spending (like education). So that leaves 13% to be eaten up by food costs. 

Categories of household spending as a percent of total expenditure 2013 vs 2018 chart
chart - consumer outlook - TRE 01/20 - chart 4

The inequality equation

There are inarguable inequalities in income and spending. Those inequalities are part and parcel of what is driving overall spending and is ironically some of the risks going forward because of the imbalanced nature of overall household consumption.

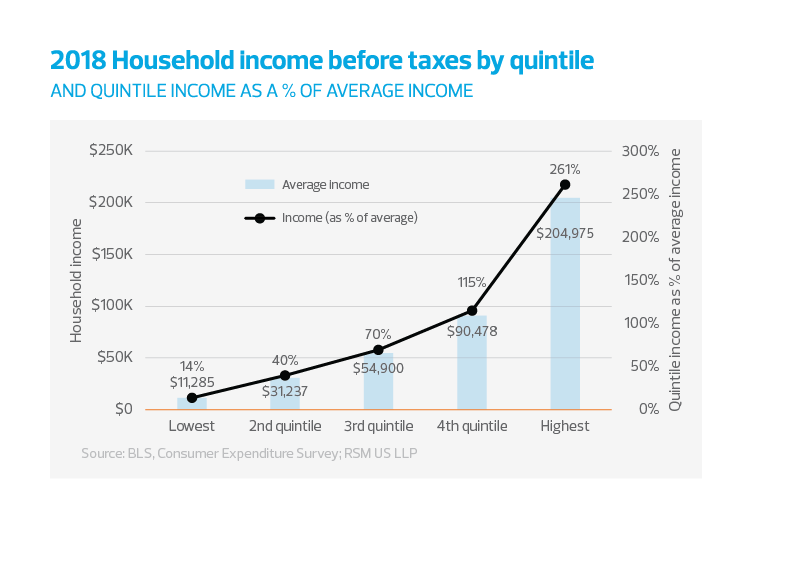
While the move to a $15 an hour minimum wage around the 20 large metro areas has modestly stimulated spending among lower-income groups, the ability of the lowest quintile of households to spend is limited by what is earned—an average of $11,000 per year. That amounts to 14% of the national average annual household income of $61,000. So while an increase in wages can obviously put more food on the table, it cannot lift an entire economy.

Even incomes in the second quintile ($31,000 a year) and third ($55,000 a year) amount to only 40% and 70% of the national average income. It’s not until the fourth quintile ($90,000) that household incomes are greater than the national average, giving some leeway for discretionary spending.

Household income in the highest quintile is $205,000 a year, which amounts to 261% of the national average, and is more than twice the income for households in the fourth quintile.

2018 Household income before taxes by quintile chart
chart - consumer outlook - TRE 01/20 - chart 5

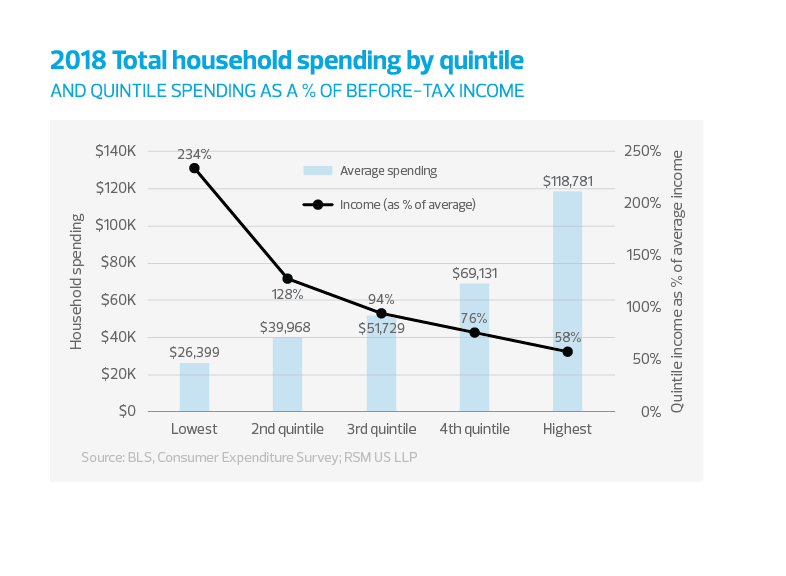
Spending patterns are just the opposite. The lowest quintile spends 234% of its annual income, with the gap financed or filled in by government programs or credit that is often accompanied by high interest rates. The level of spending increases from $26,000 a year in the lowest quintile to $119,000 a year in the highest quintile, with spending as a percent of household income decreasing the higher the quintile. 

You would have to assume that only the top two quintiles have enough discretionary income to provide the impetus for consumer spending to have an impact on overall GDP growth. But even then, you can spend only so much.

In terms of the efficiency of tax policy, middle-class households in the third quintile have expenses of $51,000 per year, which is 94% of household income. Although that’s dwarfed by the $119,000 spending by the highest quintile, the highest quintile is spending only 58% of available income. Which begs the question: Would the fiscal costs of the 2017 changes to tax policy have been better spent on the middle class, which shows a higher propensity to spend? Given the return to trend growth as the effect of the tax cut fades and with the emergence of trillion-dollar fiscal deficits, it is clear that the economy is not responding to tax cuts the way that it did in the 1980s and has not for some time.

2018 total household spending by quintile line graph
chart - consumer outlook - TRE 01/20 - chart 6

The specifics of spending

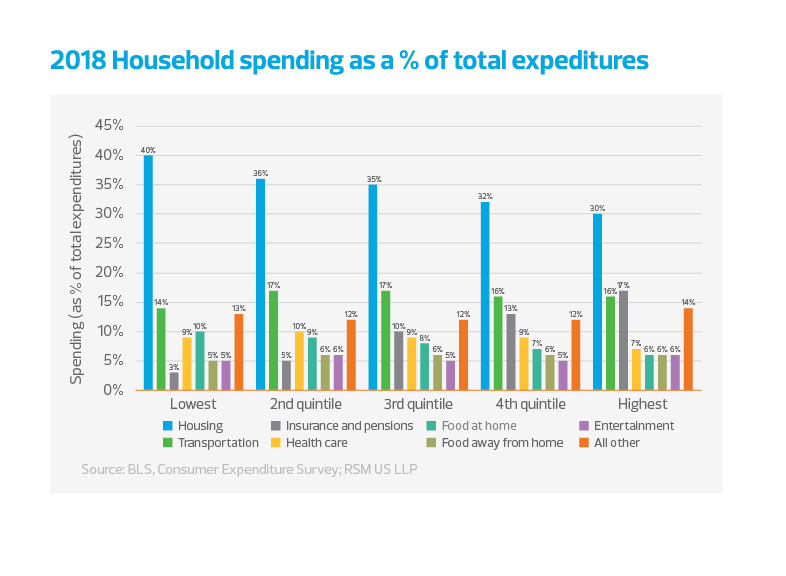
In general, households spend more on housing than anything else. For the lowest quintile, housing expenses amount to 40% of total expenses, while in the highest quintile 30% of total expenses goes to housing.

Transportation is the next largest expense for households, accounting for 14% of lowest quintile expenses and up to 15% to 17% for all other quintiles.

The lowest quintiles apply less than 3% of total expenditures on insurance and pensions. It’s hard to plan and save for the future when you don’t have enough income to pay the rent. The amount of spending on insurance and pensions rises from 3% at the lowest quintile to nearly 17% in the highest quintile.

Health care spending drops from roughly 10% of total spending in the lower quintiles to less than 7% at the highest.

The common denominator is entertainment; everyone applies about 5% of their expenses to having a good time. 

2018 household spending as a percentage of total expenditures chart
chart - consumer outlook - TRE 01/20 - chart 7

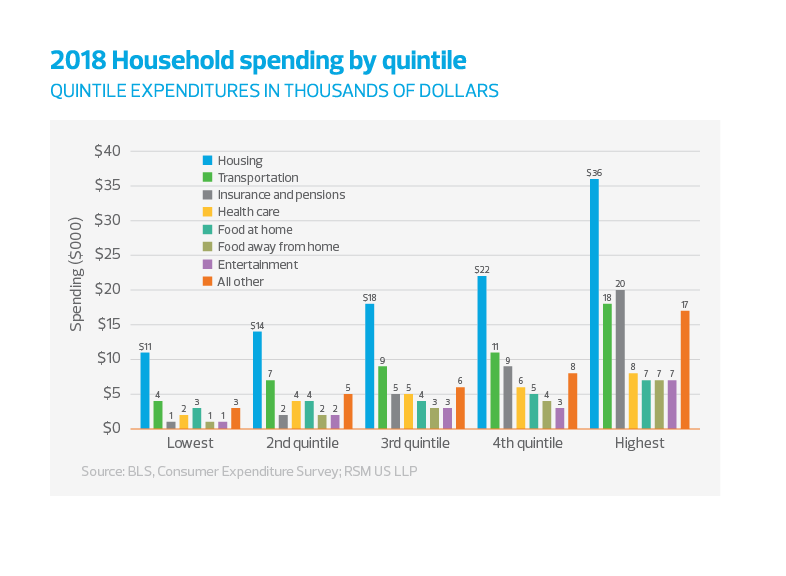
The magnitude of differences in spending illustrates why the December 2017 tax cuts were successful in temporarily stimulating the economy late in the business cycle. The increase in wealth derived from equity buybacks and the cuts in marginal tax rates for high earners were enough to maintain moderate GDP growth even as investment and exports became negative. But those cuts and the reallocation of wealth up the income ladder did not result in a permanent return to 3% growth.

2018 total household spending by quintile bar graph
chart - consumer outlook - TRE 01/20 - chart 8

Jobs, wealth and consumption 

The conventional wisdom has been that a tightening labor market and rising wages were responsible for spurts in consumer spending. That would certainly have been intuitive in the postwar industrial age, when liberal democracies were rebuilding and transforming manufacturing into consumer-driven, choice-driven enterprises. More important was the relative lack of inequality with a smaller gap between the earnings of a production worker and management.

Recent data suggests that other factors might now be at work; specifically, the diminished demand for basic manufacturing labor in the liberal economies, the growth of the low-wage service sector and growing income inequality. Now that the developed economies have established a basic social safety net for laborderived employment, what are the factors driving personal consumption?

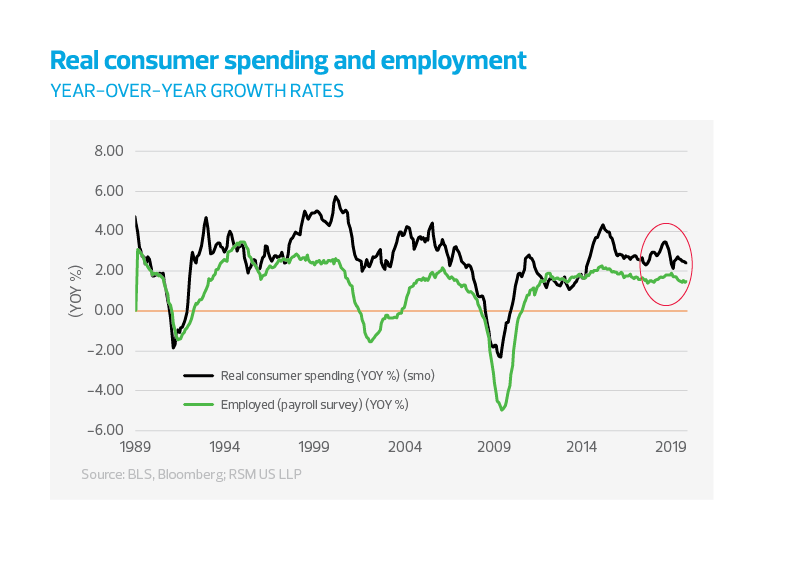
First, the availability of employment is a necessary condition for consumer spending. The correlation between real consumer spending and the yearly rate of employment growth is 70% for 1989-2019 and 85% for the 2001-19 period. Both suggest a significant relationship that demands the attention of the monetary and fiscal authorities.

Real consumer spending and employment chart
chart - consumer outlook - TRE 01/20 - chart 9

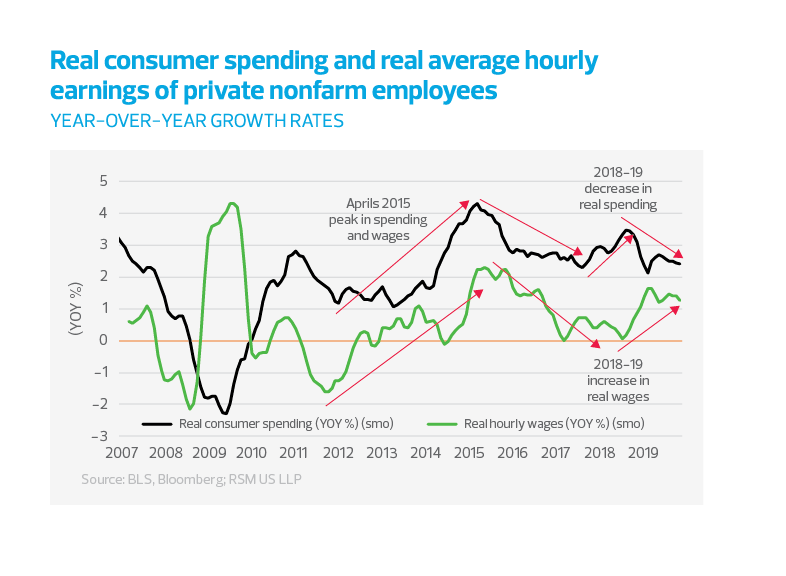
Yet it’s not sufficient for policymakers to simply rely on wage growth to keep an expansion going. The direction of consumer spending and wage growth can at times be coincident, and can at times move in opposite directions. In just the 11-year recovery and expansion following the financial crisis, there are several examples of this divergence. 

During the financial crisis, real (inflation-adjusted) spending dropped like a rock even as wages continued to grow. (This was most likely because of contractual requirements of workers lucky enough to be employed.) After the 2009 crisis, it took six years for the growth rate of consumer spending to peak at more than 4% a year in April 2015. Meanwhile, real hourly wage growth, which had been flat or negative from 2010 to 2013 in the immediate post-crisis period, began to increase before reaching a peak rate of 2.25% a year, also in 2015.

Inflation-adjusted spending then began declining until late 2017. Spending had a growth spurt in early 2018 before resuming its downward trend later in the year as the trade war and uncertainty over policy took their toll. At nearly that same point late in 2018, however, wages began increasing again as the unemployment rate reached well below equilibrium levels and a shrinking pool of available workers required higher compensation.

Real consumer spending and real average hourly earnings of private nonfarm employees chart
chart - consumer outlook - TRE 01/20 - chart 10

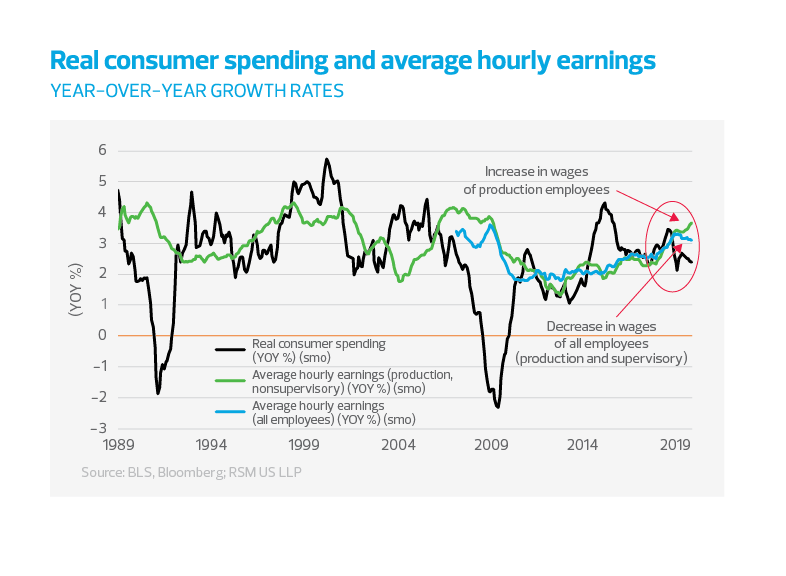
So what accounts for the divergence in spending and wages in 2018 and 2019? There are some clues within the trend in nominal wage growth, which can be broken down by employee type. Although nominal hourly earnings are rising for production (nonsupervisory) employees, when higher-wage supervisory employees are factored in, the trend in hourly earnings has declined since April 2019. A look at the three-month average annualized pace of retail sales strongly suggests that spending peaked in May 2019.

The impact of the decline in earnings for higher-wage supervisory employees becomes apparent in the delineation between household income and spending in the lower and upper quintiles. Put simply, high-income households spend more than low-wage households.

Real consumer spending and average hourly earnings chart
chart - consumer outlook - TRE 01/20 - chart 11

So in this latest cycle, it is not wages driving consumer spending as much as it is the amount of disposable income in the system. With the upper quintiles accounting for income and spending that is magnitudes higher than the lower quintiles, the data suggests that lower growth of earnings would push disposable personal income lower, and push consumer spending lower overall.

After the tax cuts were passed in December 2017, the excess cash spurred an increase in disposable income and an increase in spending that continued until January 2019.

While spending remains robust, you can only spend so much. It would be hard to argue that the tax cuts were not effective, if the goal was simply to induce spending. But investment has not responded to the flood of cash, and the U.S. export sector is still contracting.

Nevertheless, we anticipate the global economy bottoming out in coming months. That doesn’t necessarily mean a resumption of spending increases, or a snap revival of investment. Instead, we anticipate the period of slow-to-moderate growth to continue.

Real consumer spending and disposable personal income
chart - consumer outlook - TRE 01/20 - chart 12

Household balance sheets

The supposition that consumer spending will be enough to sustain GDP growth at 2% has several requirements: the willingness of consumers to continue spending, consumer access to funds and the willingness of lenders to extend credit.

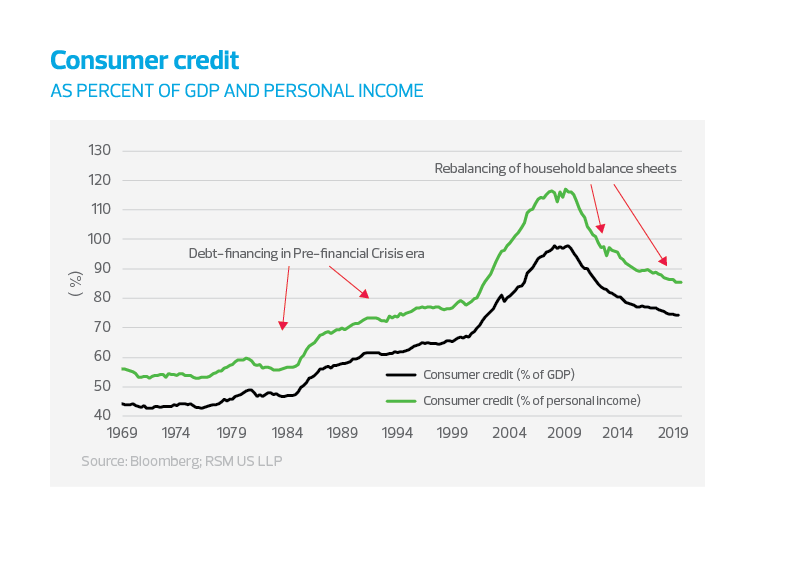
American households got in way over their heads during the run up to the 2007-09 housing-induced financial crisis. Credit balances grew to nearly 100% of nominal GDP and to 115% of personal income. Those ratios have since returned to early 2000s levels of 74% and 85%, both of which are still high relative to pre-credit card levels of the 1960s, but more symptomatic of the evolution toward a cashless society as well as the deficit of household savings.

Consumer credit chart (as percent of GDP and personal income)
chart - consumer outlook - TRE 01/20 - chart 13

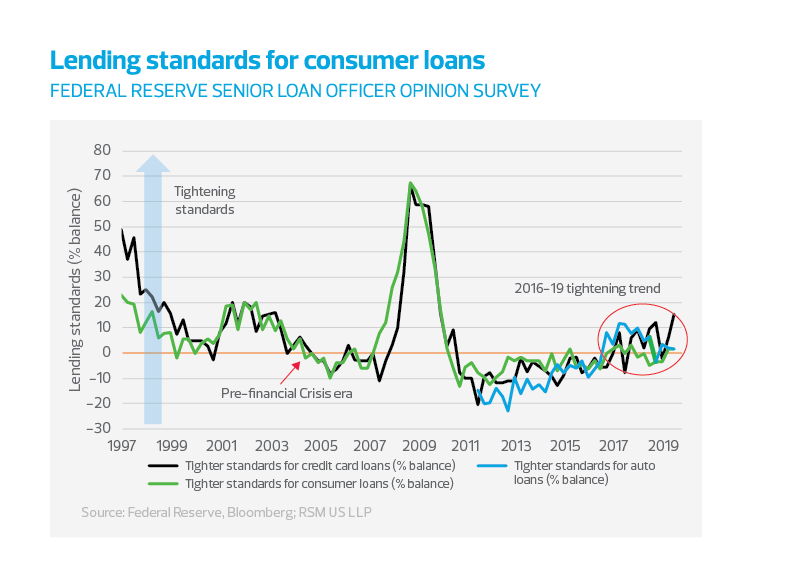
The other half of credit transactions is the willingness of banks to provide funds. While credit providers integrate a risk premium into their fees, the availability of credit is still dependent on expectations for employment, income and consumers’ ability to repay those funds.

Although new bankruptcies have declined dramatically since the financial crisis, that trend has flattened and is showing signs of turning higher again. And recognition of the increase in bankruptcies might have caused banks to tighten their standards for issuing consumer loans. 

New consumer bankruptcies (as percent of bank customers) chart
chart - consumer outlook - TRE 01/20 - chart 14
Lending standards for consumer loans (federal reserve senior loan officer opinion survey) chart
chart - consumer outlook - TRE 01/20 - chart 15

Promoting from within

As an alternative to tax cuts for the wealthy, which clearly provide short-term boosts to spending, we should consider investment in low-income earners that would have a longer-term impact on potential growth. It is critical that as the economy evolves in a digital age, pathways to prosperity should be built for those who have been left out because of the lack of education and infrastructure.

The military and corporations like McDonald’s are known for developing their workforce from within, providing employees the means to develop their skills and rise up through the ranks. General Colin Powell is a prime example, as were the Merrill Lynch chief executives who began their careers in the mailroom. A similar approach could be constructed to ensure that a large percentage of the population not be left behind as the digital economy rapidly accelerates. 

MIDDLE MARKET INSIGHT Faced with a tight labor market, middle market companies should consider retraining existing employees with the skills needed to thrive in the digital economy. 

According to a recent Brookings analysis, “Low-wage workers comprise a substantial share of the workforce. More than 53 million people, or 44% of all workers ages 18 to 64 in the United States, earn low hourly wages.”

This is due, in large part, to competition from a global supply of cheap labor and the off-shoring of basic manufacturing to low-wage centers. While this shift in labor supply is a fact of life, it does not mean we should simply walk away from society’s responsibility to provide the means for development.

From the Brookings report: “The well-educated and technically savvy find ample employment opportunities, while those with lower levels of education face a labor market that is decidedly less welcoming, with lower wages and less potential for career growth. Meanwhile, some regions dramatically outpace others in job growth, incomes and productivity, raising disquieting questions about how best to promote broad-based economic growth.”

Policy alternatives include expanding the earned income tax credit, wage subsidies and increasing the minimum wage to $15 an hour in an orderly fashion. This increase would partially shift the source of income for low-wage workers from government subsidies to corporations. A century ago, Henry Ford provided wages that were sufficient for his employees to purchase a Model-T; modern-day corporations are expected to simply outsource or automate their low-wage jobs in the name of maximizing shareholder earnings.

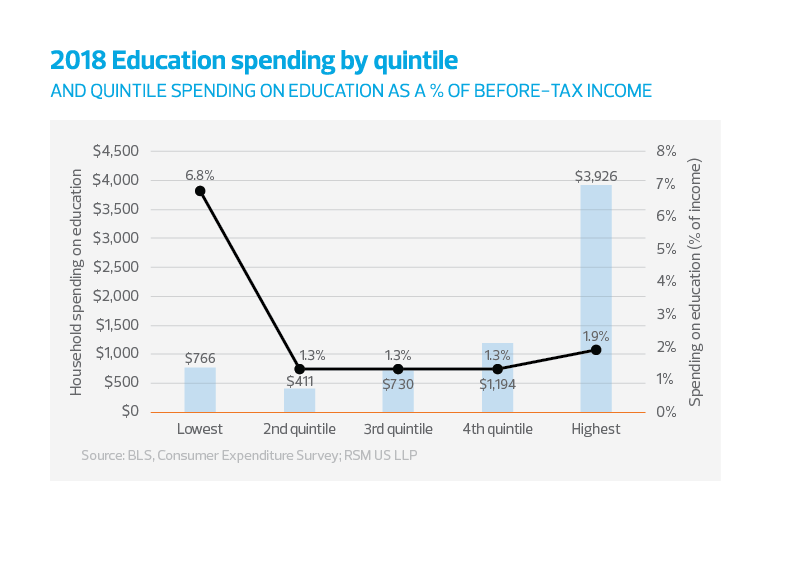
Household spending data appears to support the need for assistance. As the figure below indicates, the lowest quintile spends 6.8% of its before-tax income on education; all other quintiles spend 1.3% to 1.9% on education.

2018 Education spending by quintile (and quintile spending on education as a percentage of before-tax income) chart
chart - consumer outlook - TRE 01/20 - chart 16

Government programs in liberal democracies include an element of income redistribution, mostly in the form of progressive taxation programs that fund meanstested assistance programs. We can choose to promote long-term potential growth by providing the means for everyone—regardless of income level—to develop their individual capital through education.

Think of the role that public schools play in providing the first step, with public universities providing the ticket to the top. (In addition, public universities are subsidized research and development resources for business and technology development.)

RSM contributors

The Real Economy

Monthly economic report

A monthly economic report for middle market business leaders.

Industry outlooks

Industry-specific quarterly insights for the middle market.