The Real Economy

2020 outlook hinges on lifting uncertainty tax

January 05, 2020
#
Economics The Real Economy

The global economy has decelerated over the past two years as an uncertainty tax in the form of disruptions to the free movement of goods along the global supply chain and a broad move away from a rulesbased economic framework continue to damp overall economic activity. Even so, the global economy is likely to continue expanding around 3% in 2020, the minimum threshold before recessionary risks begin to build. In short, a number of things will have to go right with respect to trade policy and political risk to avoid growth slowing below our realistic forecast. 

Outlook for business growth

In 2020, we expect the ebbing of financial risk around Brexit, the possibility of a cease-fire in the trade war, or even the roll back of existing tariffs, to help bolster global growth. Moreover, monetary and fiscal policy stimulus should boost overall global activity in the second half of the year, though firepower is limited given political constraints across the developed economies.

To avoid a greater slowdown, the trade conflict between the United States and China will need to ease. A ceasefire is simply not enough. Rather, tariffs will need to be rolled back on both sides to create the conditions for a global reacceleration in growth. This means that both economies need the uncertainty tax lifted, which would then signal private sector firms to boost fixed investment. It is important to note that for much of 2019, an elusive trade deal did not materialize; trade policy was instead characterized by tariff increases, declining trade and lower fixed business investment. Even the recent phase one trade deal with China, which avoided a new round of tariffs from going into effect, was not substantial enough to significantly ease the uncertainty around trade. It would not take much in terms of a breakdown of the current talks between Washington and Beijing and the strains around the U.S. presidential election for a repeat in 2020.

Second, American households will need to continue to see wage gains to support consumption near the level of 2% to 2.5% to absorb the global surplus in production of goods necessary to boost overall global activity via the trade channel.

Third, while the European Union teeters on the brink of recession, global manufacturing will likely bottom out in early 2020. Even so, the German economy has plenty of spare fiscal capacity to boost growth if its economy continues to experience below-trend growth near 0.5% on a seasonally adjusted annualized basis. We expect the European Central Bank to increase monetary accommodations early in 2020, and we think an important conversation about the use of the fiscal channel to boost growth will start in European policymaking circles, which will be one of the major global narratives in 2020. 

Estimates by the International Monetary Fund indicate that the world economy—which includes both developed and emerging economies— slowed to 3.0% from a growth of 3.75% in 2017. But more disturbing for the U.S. business community are estimates by the Organization for Economic Cooperation and Development that economic growth in the 45 developed economies declined to 1.8% in 2019 from 2.6% in 2018.

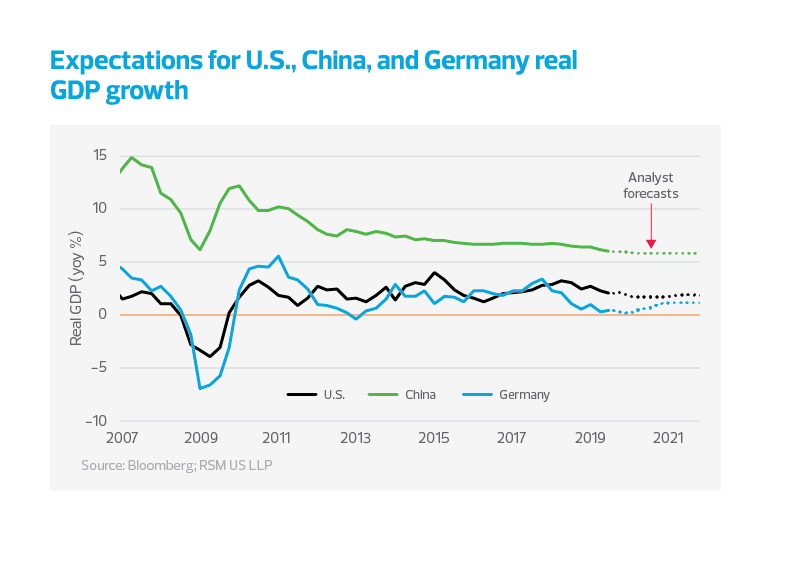
Expectations for U.S., China, and Germany real GDP growth
chart - uncertainty tax - TRE 01/20 - chart 1

The modest expectations for 2020 are what one would call realistic, and the consensus forecast of economists is for modest growth in the following two years. That could have an enduring impact on U.S. exporters and for those U.S. businesses looking to expand their market. Given the pullback of the United States from the global economy over the past two years, internationally active firms are legitimately questioning why they should trade with the United States and risk disruption to supplies of goods or loss of sales.

Long-term global economic challenge: Demographic change

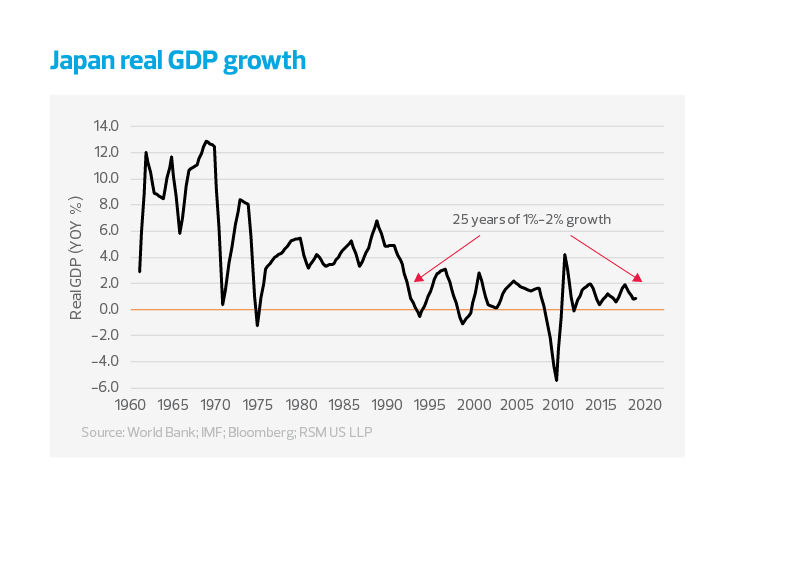
Many analysts refer to the so-called Japanification of the developed economies, as an extended period of slow growth and low inflation linked to aging societies. Japan— once the driver of innovation and investment—grew old and stopped innovating. Its population became stagnant because of passive societal decisions that reduced the country’s birth rate and limited immigration. Without a young, growing population to replenish the labor force, economic growth became impossible, and for the past 25 years, Japan’s economic growth has become rangebound at less than 2% annually. 

Japan real GDP growth chart
chart - uncertainty tax - TRE 01/20 - chart 2

Indeed, in the advanced economies, the aging societies present long-term challenges to growth, given the move to limit immigration into those economies. 

Global manufacturing activity

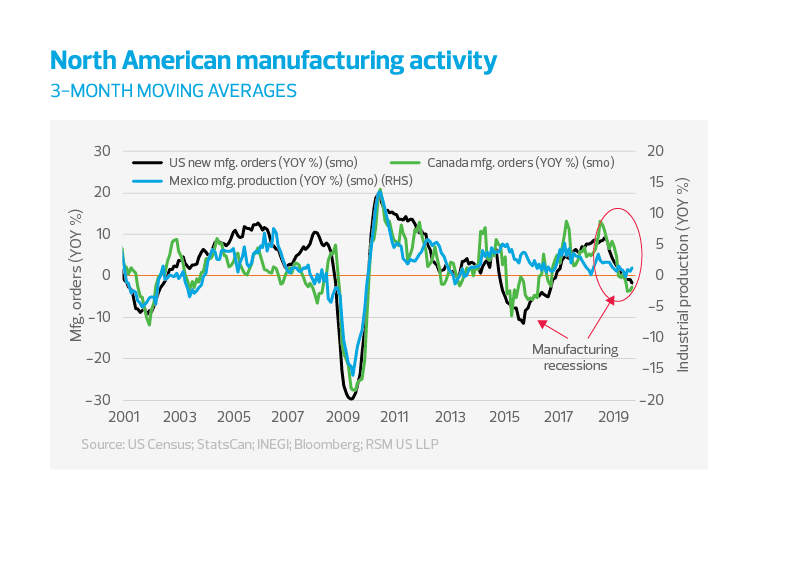
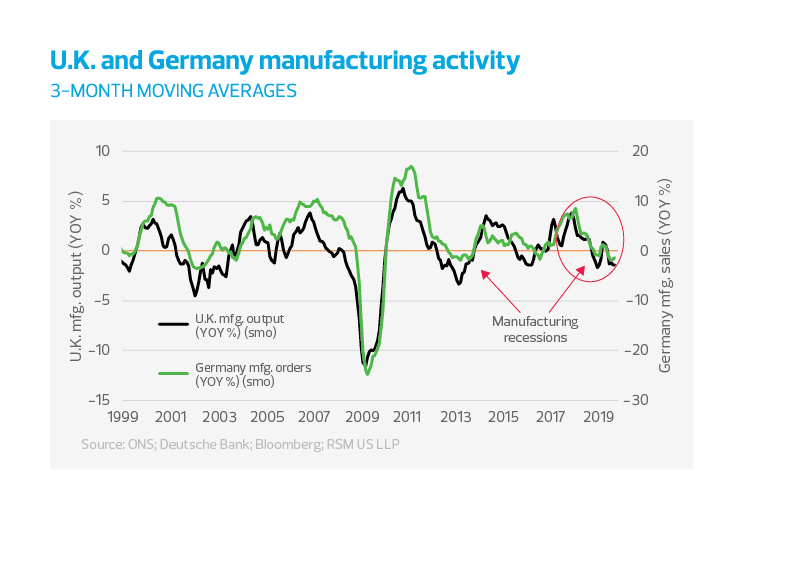
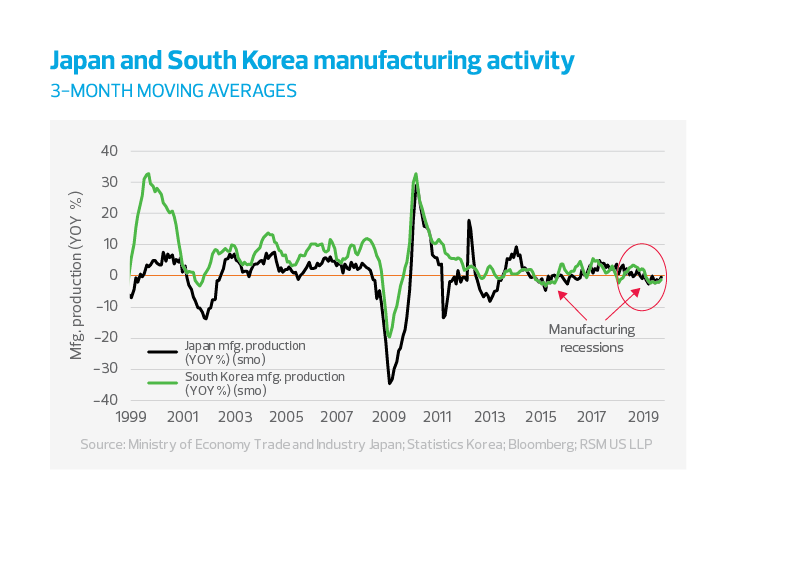
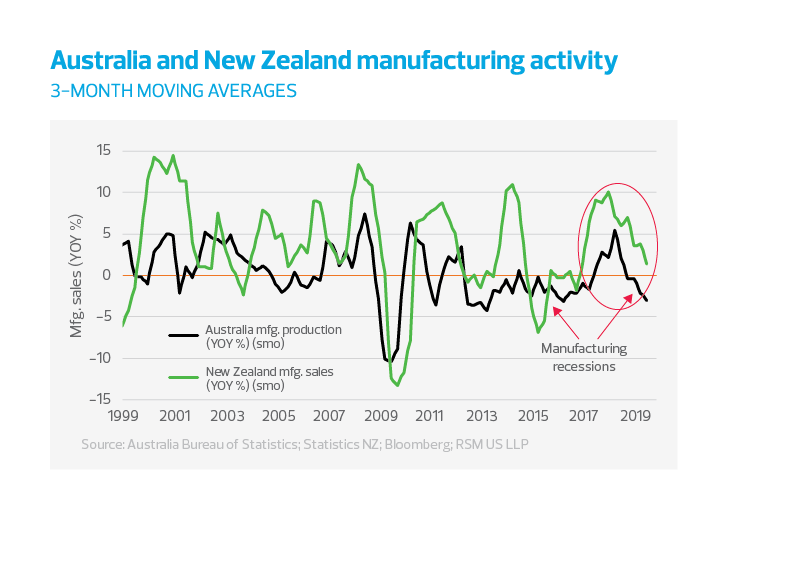
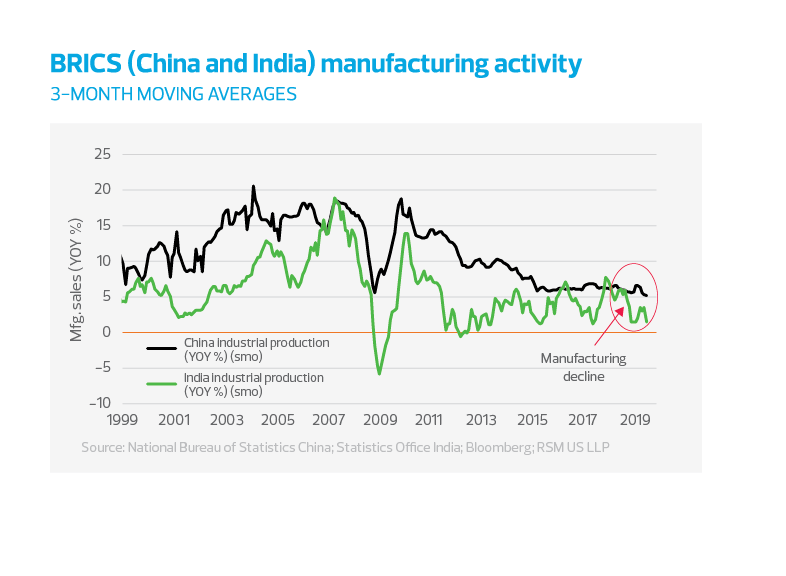
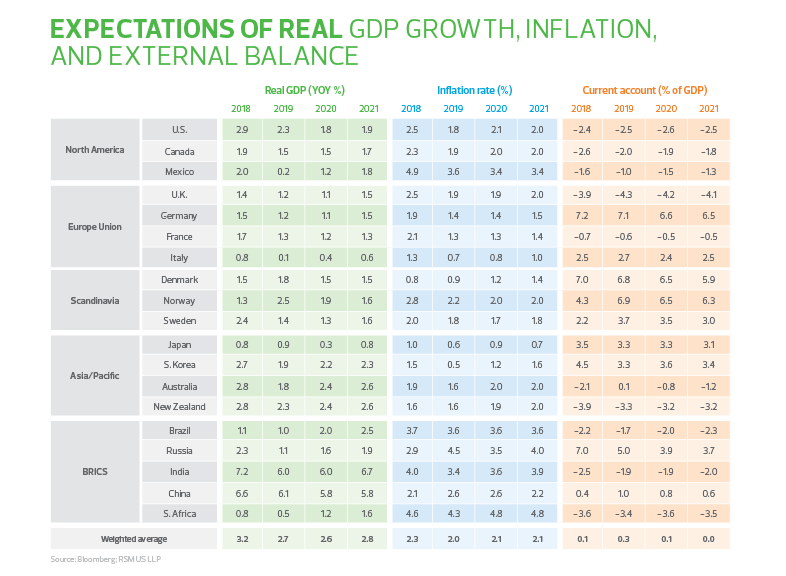
As the following figures suggest, most of the developed world, including the United States, is already in a manufacturing recession. And as the table below indicates and is perhaps most threatening, real gross domestic product growth is decelerating, and inflation trends have reversed direction, a symptom of insufficient demand and a lack of confidence. Because of the threats to economic growth from trade wars and the lack of investment related to political and policy uncertainty, short-term interest rates around the world remain low, with more than $12 trillion in negative yield government securities and more than $1 trillion in private-label government securities yielding negative rates. Given the difficult economic and financial landscape, it is clear that growth via the fiscal channel is going to be key to resuscitating global manufacturing growth opportunities. The following is a look at global manufacturing conditions. 

Manufacturing outlook among the developed economies

North American manufacturing activity chart
chart - uncertainty tax - TRE 01/20 - chart 3
U.K. and Germany manufacturing activity chart
chart - uncertainty tax - TRE 01/20 - chart 4
France and Italy manufacturing activity
chart - uncertainty tax - TRE 01/20 - chart 5
Scandavania manufacturing activity
chart - uncertainty tax - TRE 01/20 - chart 6
Japan and South Korea manufacturing activity chart
chart - uncertainty tax - TRE 01/20 - chart 7
Austraila and New Zealand manufacturing activity chart
chart - uncertainty tax - TRE 01/20 - chart 8
BRICS (China and India) manufacturing activity chart - 3 month moving averages
chart - uncertainty tax - TRE 01/20 - chart 9
BRICS (Brazil/Russia/South Africa) manufacturing activity chart
chart - uncertainty tax - TRE 01/20 - chart 10

Expectations of real GDP growth, inflation, and external balance

Expectations of real GDP growth, inflation, and external balance table
chart - uncertainty tax - TRE 01/20 - chart 11

RSM contributors

The Real Economy

Monthly economic report

A monthly economic report for middle market business leaders.

Industry outlooks

Industry-specific quarterly insights for the middle market.