The Real Economy

RSM US Real GDP Index

RSM monthly GDP Model signals slowing growth

Sep 03, 2019

Midway through 2019’s third quarter and less than six weeks from the first official estimate of the period’s growth on Oct. 30, it’s never too soon for middle market businesses to begin planning. A continual flow of economic data releases and revisions can provide the means to assess what might be coming down the pike.

The initial estimate from the Bureau of Economic Analysis shows growth in the second quarter slowed to a 2.1% annualized pace (2.2% on a year-over-year basis), following an inventory buildup that powered surprise growth of 3.1% in the first quarter.

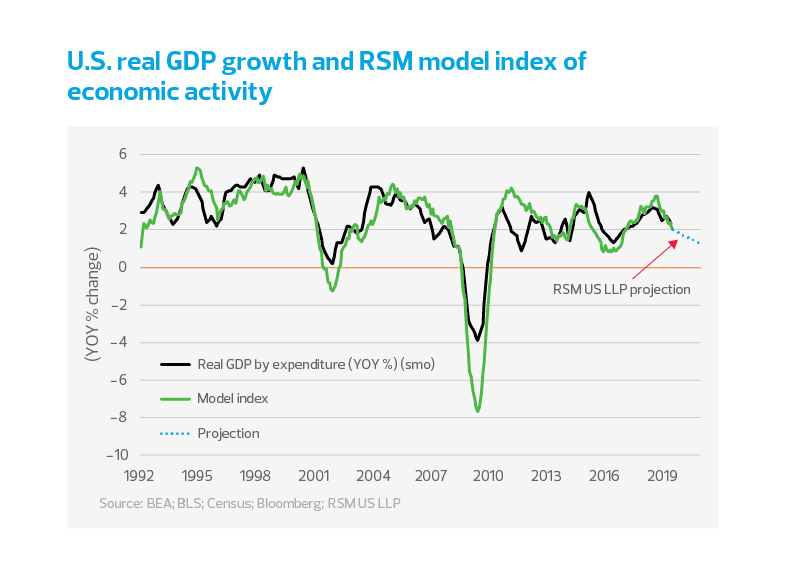
RSM has developed a monthly measure of gross domestic product, which indicates that GDP growth has been decelerating since November 2018, pacing at 3% in the early months of 2019 before dropping to 2.2% by June (see chart below). The RSM US Real GDP Index confirms that growth would have been worse if not for the injection of buoyancy from the stockpiling of inventory, likely the result of business uncertainty stemming from threats to the global supply chain such as tariffs. With July’s industrial production dropping to less than 0.5%, and signs of deterioration in the labor market, the third quarter has begun with a whimper.

What accounts for the slowdown in growth?

The current business cycle—extended by the Tax Cuts and Jobs Act passed at the end of 2017—likely peaked in the third quarter of 2018 after the immediate effect of the front-loaded corporate tax cuts dwindled. At least some of the slowness in growth since 2018 appears to have been self-inflicted.

As shown below, nonresidential investment (dashed blue line) did not respond to the tax cut and continued to decelerate before turning negative.

The most likely reason for the economic slowdown is the indirect cost of the trade war between the United States and China. Tariffs implemented by the United States in the first half of 2018 have resulted in disruptions and diversions in the global supply chain, uncertainty for businesses and investors, and subsequently, retaliatory reduction in purchases of U.S. goods by China.

As shown below, growth of exports has diminished since the tariffs began, first turning negative in the third quarter of 2018 and then again in the second quarter of 2019. Import growth has diminished as well, which adds to the global slowdown.

Where do we go from here?

We suspect the business cycle might have peaked in the last half of 2018 and that the 10-year economic recovery following the Great Recession has finally run out of steam. The 2.2% GDP growth rate fits well within the range of growth during the period of recovery after the financial crisis of 2007-09 and the subsequent Great Recession. But growth has, nevertheless, fallen below its medium-term trend.

The Real Economy

Monthly economic report

A monthly economic report for middle market business leaders.

Industry outlooks

Industry-specific quarterly insights for the middle market.