A big beneficiary of spending in recent years has been consumer products companies.
Key takeaways
There is evidence that some of that spending on discretionary goods is receding.
Now, firms are looking to the “premiumization” of everyday products to capture dollars.
American consumers have shown remarkable resilience as the economy has rebounded from the depths of the pandemic. Overall spending has remained robust, despite elevated inflation and rising interest rates.
But that could be changing. Lower-income consumers have started to show cracks in demand, and that could spread as the Federal Reserve’s rate hikes and recent banking instability take their toll.
The following analysis looks at where consumer spending has been concentrated over the last three years, the difference in buying power across income quartiles and other macroeconomic factors that will affect spending moving forward.
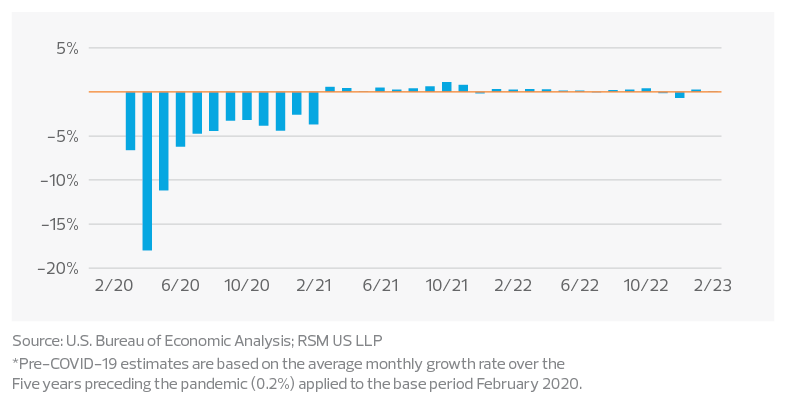
Spread between real consumption and pre-COVID-19 estimates*
Consumption overview and outlook
After the initial shock of the pandemic in March and April 2020, the spread between cumulative real consumption (adjusted for inflation) and pre-COVID-19 estimates reached a trough of 18.0%, as the unemployment rate reached an all-time high, 14.7%, in April 2020. Aided by economic stimulus payments, real spending exceeded pre-COVID-19 estimates in March 2021 and continued through that December, when a resurgence of the coronavirus cut into spending. But even with that pullback, real spending increased 8.3% in 2021, after a 3.0% decline in 2020. Last year, overall consumption continued to grow, increasing 2.8%.
Goods vs. services consumption
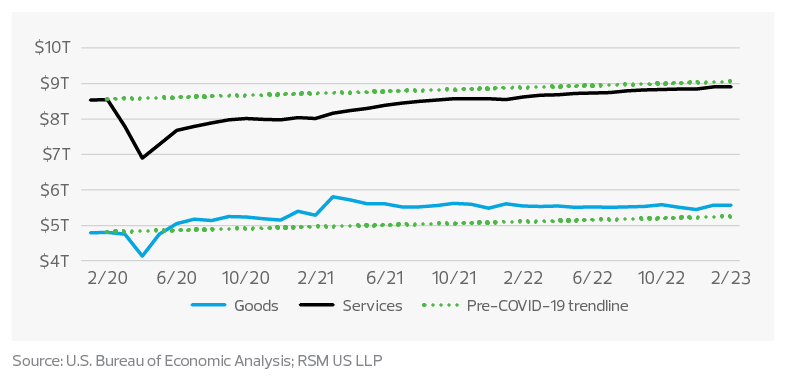
The largest beneficiary of spending over the past three years has been consumer products companies. In the five years before the pandemic, monthly spending on services like dining out, travel and home repairs averaged 65% of total monthly consumption. But since March 2020, this percentage has declined to 61%, with the balance shifting to goods.
Percentage of monthly consumption for discretionary consumer goods–in real dollars
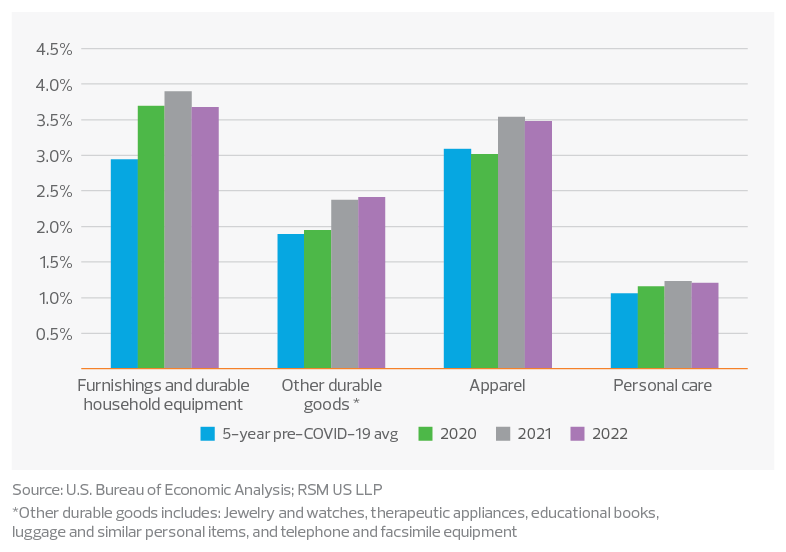
Discretionary consumer categories have benefited from this shift as monthly wallet share percentages continue to exceed the five-year pre-COVID-19 average. For example, furniture and home furnishings accounted for 2.9% and apparel 3.1% of monthly consumption on average in the five years before the pandemic. In 2021, these percentages increased to 3.9% and 3.5%, an increase of 34.5% and 12.9%, respectively. Much of the demand for these goods was driven by the refinance and renovation boom in 2021 spurred by historically low mortgage rates, as well as the shift to hybrid work and repurposing of wardrobes toward athleisure and luxury goods.
With the second quarter underway, however, there is evidence that some of the spending on discretionary goods has begun to recede. Over the past 12 months, monthly wallet share for home furnishings and apparel has fallen from the peak in 2021, and many public statements from consumer products companies have pointed to softness in demand.
Excess savings impact
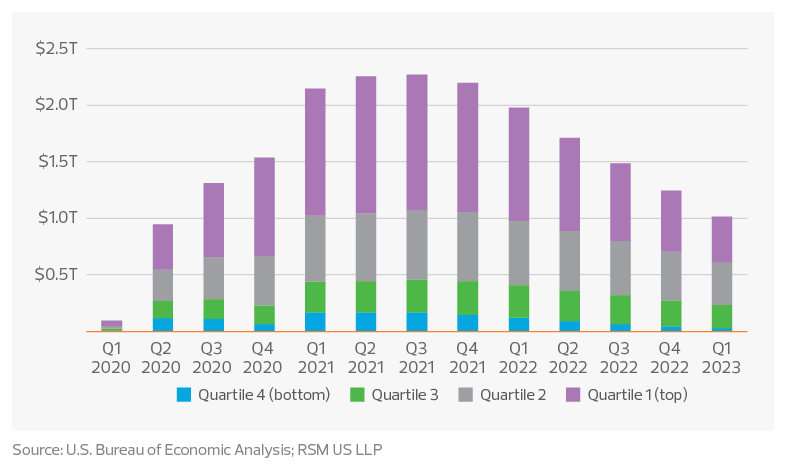
Excess savings have been a significant tailwind for consumers since early in the pandemic. Even with an estimated $1 trillion of excess savings remaining, though, this is not expected to have the same impact on consumption as it did in 2021, because nearly 75% of excess savings is concentrated among the top two quartiles of income earners.
Since this cohort accounts for approximately 60% of consumption, many consumer products companies are leaning into the “premiumization” of everyday products, in an effort to capture discretionary dollars from those willing and able to spend. However, as more everyday products target top income earners, this will put further pressure on lower-quartile earners, who have eaten into nearly all their excess savings, based on our estimates.
Cumulative excess savings by income level since 2020
Debt levels by quartile
Consumers are known to stop spending not when they should, but rather when they have to. For some income levels, the point at which they should have curtailed spending has most likely already passed. Consumer debt levels showed year-over-year increases for all income quartiles in December 2022, with the exception of the top quartile, according to the Federal Reserve.
As the second quarter approaches, there is evidence that some of the spending on discretionary goods has begun to recede.
In addition, the total consumer debt attributed to the lower two quartiles reached nearly 92%, the highest concentration of consumer debt in this cohort in 10 years, with a large portion attributed to student loans. But it excludes the impact of buy now, pay later, which has grown to include everyday products, suggesting the debt burden for the lower-income quartiles is greater than it appears.
Consumer debt by income level*
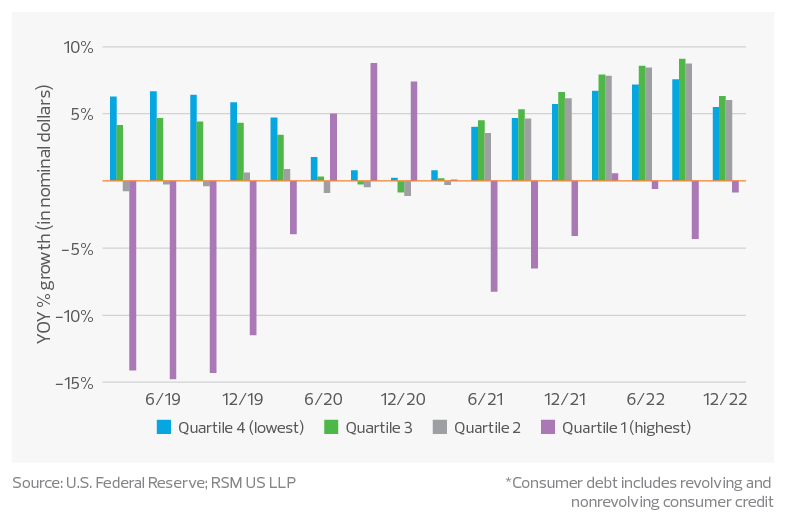
While the most recent consumer price index experienced a top-line decline to 5.0% in March, inflationary pressures for fixed monthly categories remain elevated and continue to disproportionally affect lower-quartile earners’ ability to spend, forcing those consumers to dip into savings or rely on debt to purchase everyday goods. In addition, these consumers typically do not have the benefit of a hybrid workplace and will be hurt by higher gas prices, similar to last summer.
Amid sustained inflationary pressures, consumer shopping patterns appear to have shifted toward discount and club stores and products, shelf-stable food, and private label goods, which indicates upper-level consumers are trading down and looking for value.
Unemployment and real wages
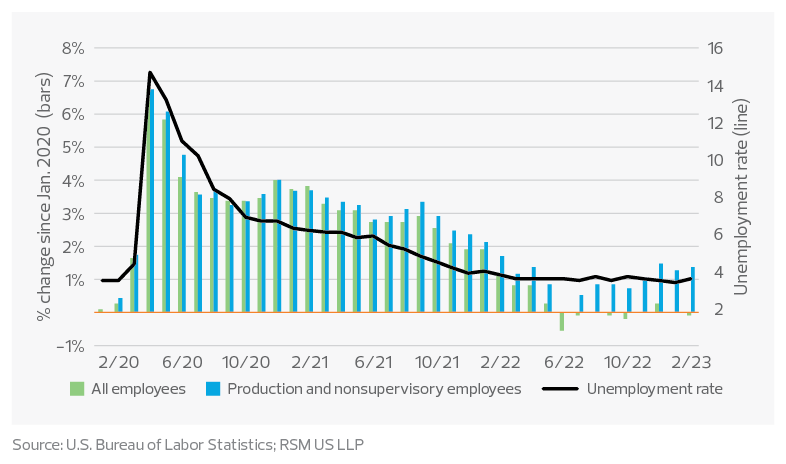
Finally, labor continues to be a bright spot for consumers. With the unemployment rate at 3.5% for March, there is no shortage of open jobs. As long as consumers have a consistent paycheck, some discretionary spending will most likely continue. Further, while excess savings levels have fallen for lower-income earners, real wages for production and nonsupervisory employees increased by 1.4% in February, providing critical financial support.
The takeaway
While consumer spending has returned to pre-COVID-19 expected levels and some tailwinds remain, particularly for upper-income employees, a consumer pullback is likely a matter of when, not if, consumers pull back. Understanding the pressures across income quartiles will be critical in future periods for consumer products companies.
While upper-income earners continue to maintain ample savings to spend at will, and since this cohort accounts for the majority of consumer spending, overall retail sales or consumer spending growth could mask the pressures felt by other consumers. As long as inflation—especially on food, gasoline and shelter—remains elevated, lower-quartile earners will continue to face sustained financial pressure and will have to start pulling back on their spending habits, if they have not already done so.


