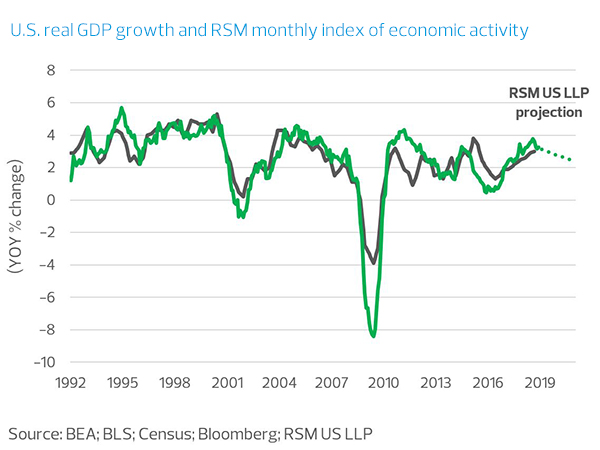
Our new RSM monthly index of real GDP growth in the U.S. economy points to a return to below 2 percent growth in the near-term. The results, in line with our current baseline expectation for 2019 and 2020, were derived after applying forecasts of key economic indicators to determine baseline projections for U.S. real GDP growth for the coming two years.
The new index is based on a subset of monthly economic indicators used by the National Bureau of Economic Research (NBER) to determine the beginning and end of U.S. business cycles. The advantage of using this data over the quarterly national accounts values of real GDP growth is the timeliness of monthly indicators that are, for the most part, accessible and understandable to all market and industry participants.
We will now include this timely monthly index of real GDP growth in each monthly issue of The Real Economy.
The six indicators (and their sources) used in the model are:
- Industrial production (Federal Reserve)
- Manufacturing and trade sales (Census)
- Real consumer spending (Bureau of Economic Analysis)
- Real disposable personal income (Bureau of Economic Analysis)
- Aggregate hours worked (Bureau of Labor Statistics)
- Number of payroll employees (Bureau of Labor Statistics)
As NBER’s choice of these indicators changes over time, we anticipate modifying our index accordingly.
The variables in the model are represented in year-over-year percent change terms, with smoothing applied to the consumer spending and disposable personal income indicators. Note that the model has over predicted the rate of growth of real GDP by only 0.2 percentage points on average in the post-crisis era (2010-2018), but over predicted the 3.0 percent third-quarter 2018 growth rate by 0.6 percentage points (We expect that difference to diminish as the smoothing works its way through the consumer sector).
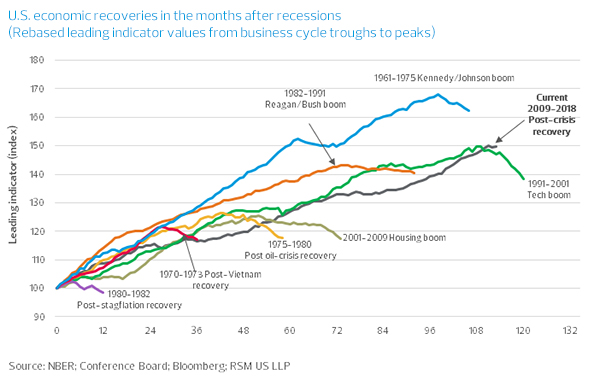
After a year of above-average growth, our projections assume that growth rates of the indicators included in our model will mean revert over the course of 2019 and real GDP growth will move toward a 1.8 percent to 2.0 percent yearly pace. We expect the historically long expansion to begin to unwind in the face of the following: threats of disruptions to the global supply chain; investment uncertainty due to rising interest rates (both at the front-end of the yield curve as the Federal Reserve continues its program of normalizing interest rates, and at the long end of the yield curve as the market begins pricing in the impact of servicing an outsized budget deficit); and as the unwinding of this year’s fiscal stimulus becomes a drag on growth.


