The Real Economy

Making sense of inflation: Learnings from post-recession recoveries

Apr 05, 2021
#
Economics The Real Economy

It's a central tenet of economics: We should expect prices to rise when the demand for goods and services increases, and to decline when demand diminishes. Price rigidity and the presence of product choices will dictate the speed at which price changes occur.

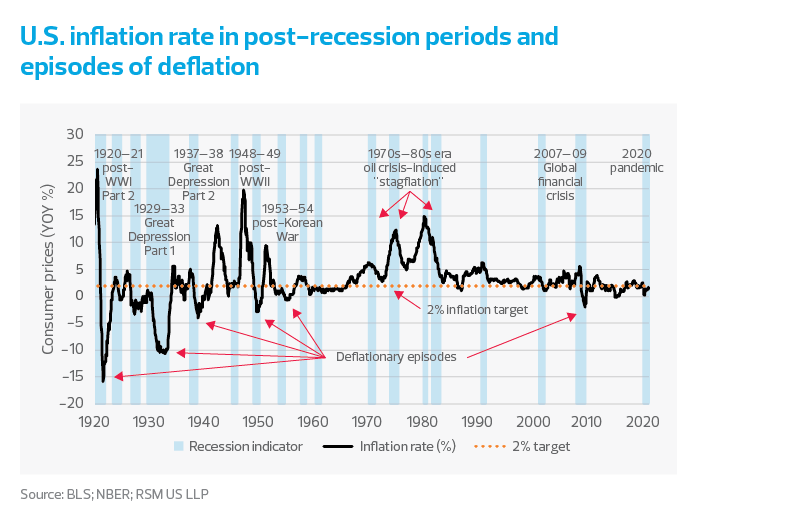
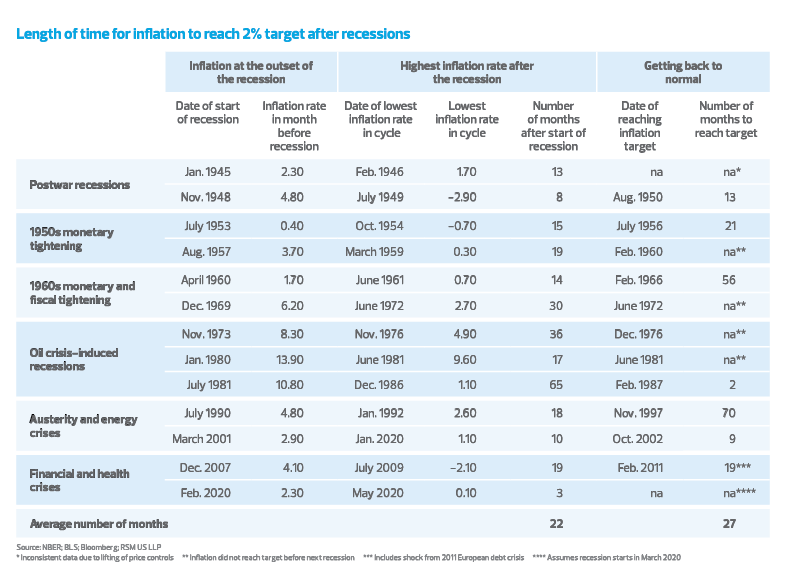
This has held up in our analysis of the postwar business cycles, which shows that inflation does indeed drop when demand falls during an economic downturn. The lowest rate during the cycle normally occurs 22 months after the start of the recession.

It can then take an average of 27 months for inflation to return to normal as sustained economic growth is attained and inflation reaches its assumed 2% target. This implies that some of the recent concerns around inflation are premature and that risks around the outlook linked to higher pricing are overblown.  

We are now more than 12 months into a unique pandemic-induced recession. Because of the demand shock caused by the pullback of households and government-mandated economic shutdowns, it took only three months to reach the low point in inflation for this cycle. Does that mean that, because of the large amount of fiscal aid already applied and the accompanying debt, inflation will skyrocket? 

U.S. inflation rate in post-recession periods and episodes of deflation

We contend that the underlying forces of the economy are unlikely to generate anything like the hyperinflation that plagued Germany after the First World War, or the product shortages that plague the broken-down economy in Venezuela today. 

Rather, we anticipate the relative stability and moderate growth that characterized the decade long recovery from the Great Recession as the economy continues its transition from one based on manufacturing to one based on information and digital technologies. 

Most important, inside the digital transformation of the U.S. economy lies a powerful downward pull on pricing as quality improvements and the decline in prices toward zero for all things digitized affect overall inflation. 

Length of time for inflation to reach 2% target after recessions

Wage pressure

During previous business cycles, consumer price inflation was considered a byproduct of wage inflation. If wages were increased, then the demand for scarce goods would pressure the price of those goods higher in a closed economy.

While this could seem reasonable, there were other factors at play, including the supply and cost of energy—think of the twin oil shocks of the 1970s or the natural gas revolution of the past two decades—that affected the entire economy and were important determinants of inflation. 

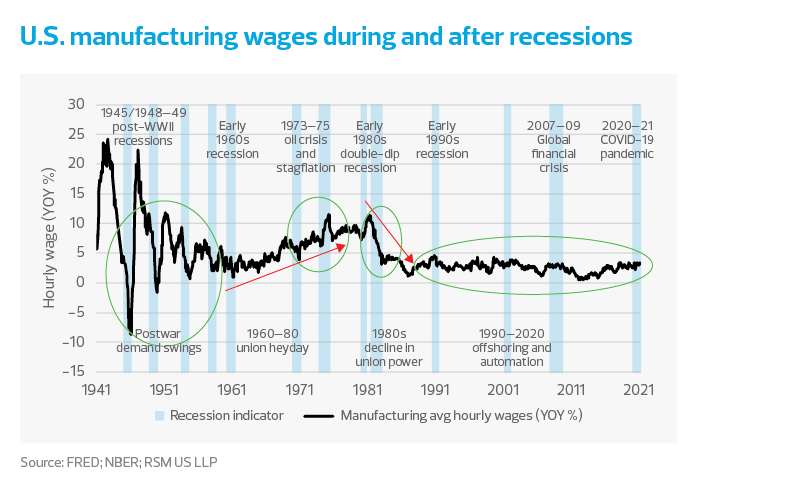
U.S. manufacturing wages during and after recessions

If there was a break in the impact of wages on consumer prices, it occurred during the double-dip recession of the early 1980s. That period marked a confluence of factors, including the sharp reduction of labor union representation, the development of the global supply chain, automation and, in the ensuing decades, the development of the digital economy. 

By 1983, following two short and painful recessions, the rate of change in manufacturing wages dropped sharply and never recovered.

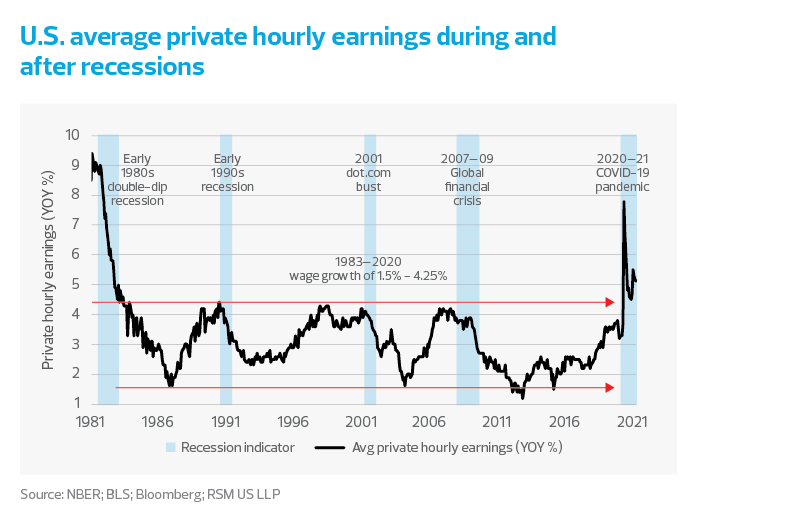
Average hourly earnings, which includes white- and blue-collar employment, have grown within a 1.5% to 4.25% range, dropping during recessions and then increasing during the following recovery as employers compete for a limited supply of labor. 

The current labor market has had a unique impact on average earnings. The economic shutdown resulted in instant furloughs of staff, leaving only the highly paid and most capable workers left to operate the business. That has distorted top-line figures of wage gains, making them look much stronger than they actually are and underscoring our view of a K-shaped economic and wage recovery. We anticipate that dynamic to lessen when the economy finally reopens. 

U.S. average private hourly earnings during and after recessions
chart - making sense - TRE 04/21 - chart 3

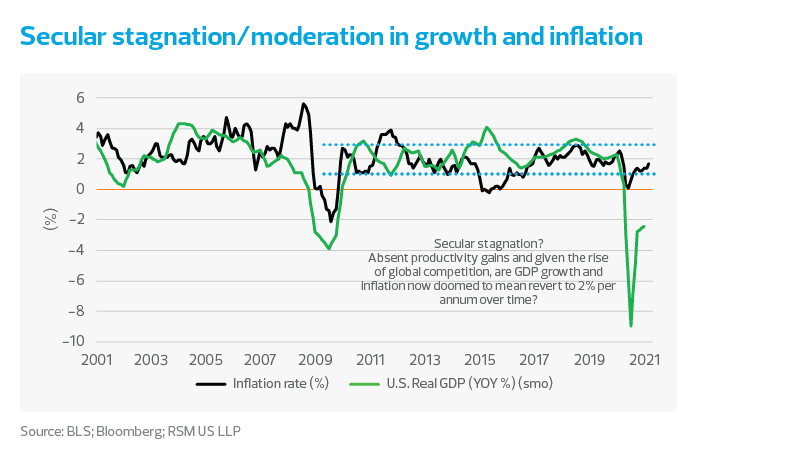
Moderation of economic growth and inflation

Inflation can arise from a supply shock (for example, the oil embargoes of the 1970s), or, conversely, a lack of inflation can exist because of weakness of demand. The U.S. economy has undergone two shocks in the past 14 years (the 2008-09 financial crisis and the 2018-21 trade war and pandemic), both of which caused sharp reductions in demand and disinflation that threatened to devolve into deflation.

Outside of the shocks, both the economy and prices settled into a narrow range of moderate growth and moderate inflation from 2010 to 2020. While stability is a good thing, economic growth that cannot get above 2% doesn’t leave much room for policy error. The proof of that hypothesis is the reaction of the global economy to the trade war, which pushed the U.S. economy perilously close to recession in the years before the pandemic.

Let’s not forget that the moderation of inflation in this latest period is also because of decreases in production costs (through automation) and the availability of alternative sources of supply along a now-global supply chain.

Economic analysis now recognizes the interconnectedness of all of these factors, rather than simply accepting the adage that inflation is determined by the supply of money or the amount of debt. 

That is why the idea that inflation is always a monetary phenomenon does not resonate in this economy the way it did in previous eras. There have been enough examples to put those notions to rest.

Secular stagnation/moderation in growth and inflation

The impact of inflation on interest rates

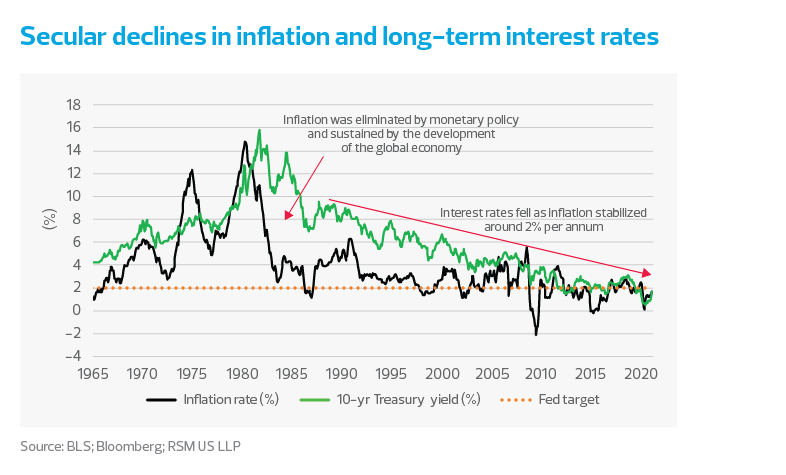
Long-term interest rates in the United States are comprised of two components: expectations for short-term money-market rates anchored by the monetary authorities at the Federal Reserve, and a risk premium for holding the long-term security over the life of the bond. That risk premium includes expectations for episodes of inflation (or deflation) occurring during the investment period. 

As we show in the following figure, the risk of inflationary periods was gradually squeezed out of that calculation by the maturation of monetary policy during the 1970s. Inflation rates and Treasury yields that were 14% to 16% in 1981 are now 1% 40 years later.

Until January, the bond market was still pricing in the risk of policy errors and the risk of deflation into the yield of 10-year Treasury bonds. Recent moves in the 10-year yield to above 1.5% can be construed as a vote of confidence in the monetary and fiscal authorities’ ability to contain the pandemic and to increase economic demand such that inflation reaches the Federal Reserve’s 2% target. 

Secular declines in inflation and long-term interest rates

Inflation expectations

If short-term rates–which are determined by the monetary authorities–are a component of interest rates, is measuring inflation expectations a valid exercise?

There are two methods of determining inflation expectations: surveys of public sentiment, and market-based indicators. Both methodologies are crowd-sourced and arguably based more on the current level of inflation than on clairvoyance. 

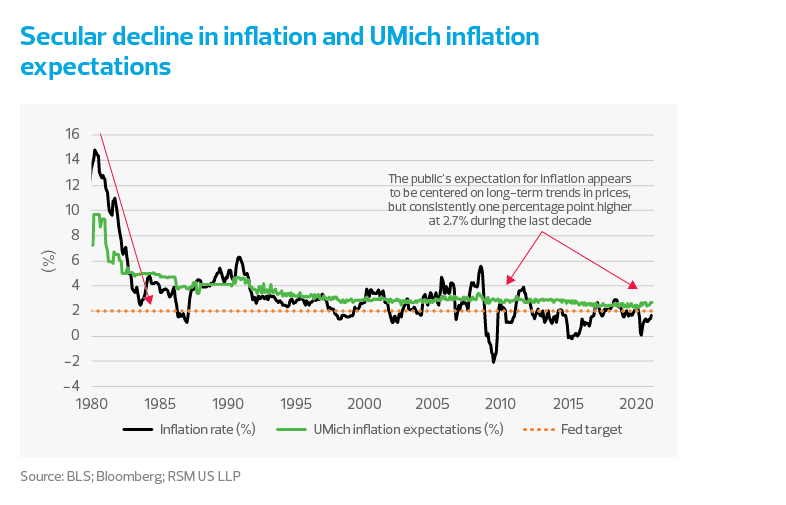
The University of Michigan’s survey of the public’s five-year inflation expectations has followed the secular decline in inflation. Over the past decade, the survey results have reported forecasts that were consistently a full percentage point over actual inflation. 

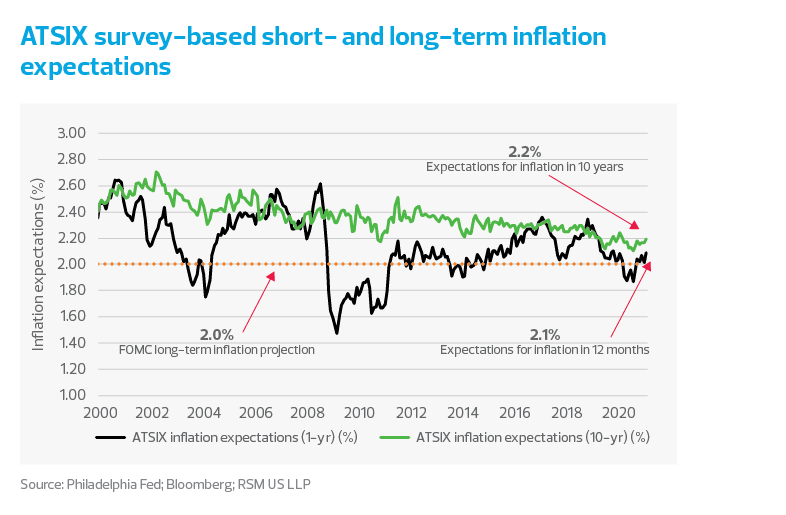
The ATSIX (Federal Reserve Bank of Philadelphia) compilation of surveys has inflation rising to 2.1% over the next 12 months and to 2.2% over the next 10 years, both of which are close to the forward guidance from the Federal Open Market Committee.

Secular decline in inflation and UMich inflation expectations
chart - making sense - TRE 04/21 - chart 6
ATSIX survey-based short- and long-term inflation expectations
chart - making sense - TRE 04/21 - chart 7

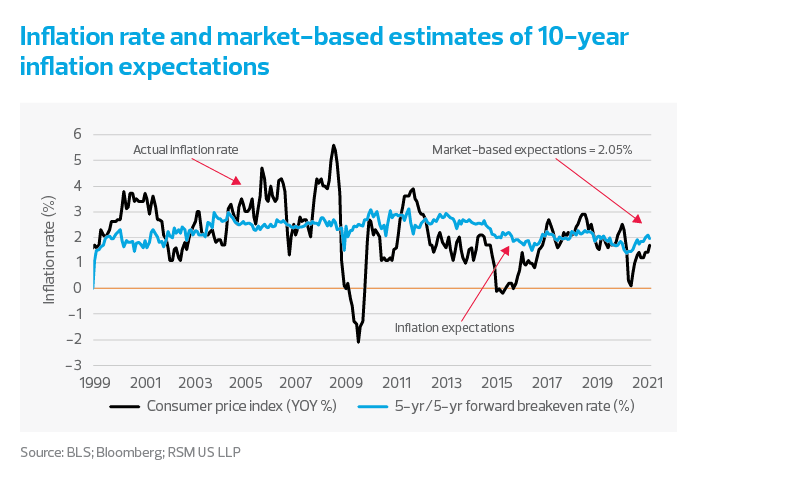
Analysis of the price of financial assets can be used to derive the rates of inflation expectations built into those prices. Again, the information built into those assets is arguably contained in the forward guidance of the monetary authorities who are responsible for the direction of inflation, economic growth and short-term money market rates.

Inflation rate and market-based estimates of 10-year inflation expectations

RSM contributors

The Real Economy

Monthly economic report

A monthly economic report for middle market business leaders.

Industry outlooks

Industry-specific quarterly insights for the middle market.